📊Try Astrato now, no sign-up required. Explore our Data Apps Gallery.
🗺️📊📍Astrato Mapping has landed – see our blog post on Modern Geospatial Analytics.
Astrato
No-code guided data apps
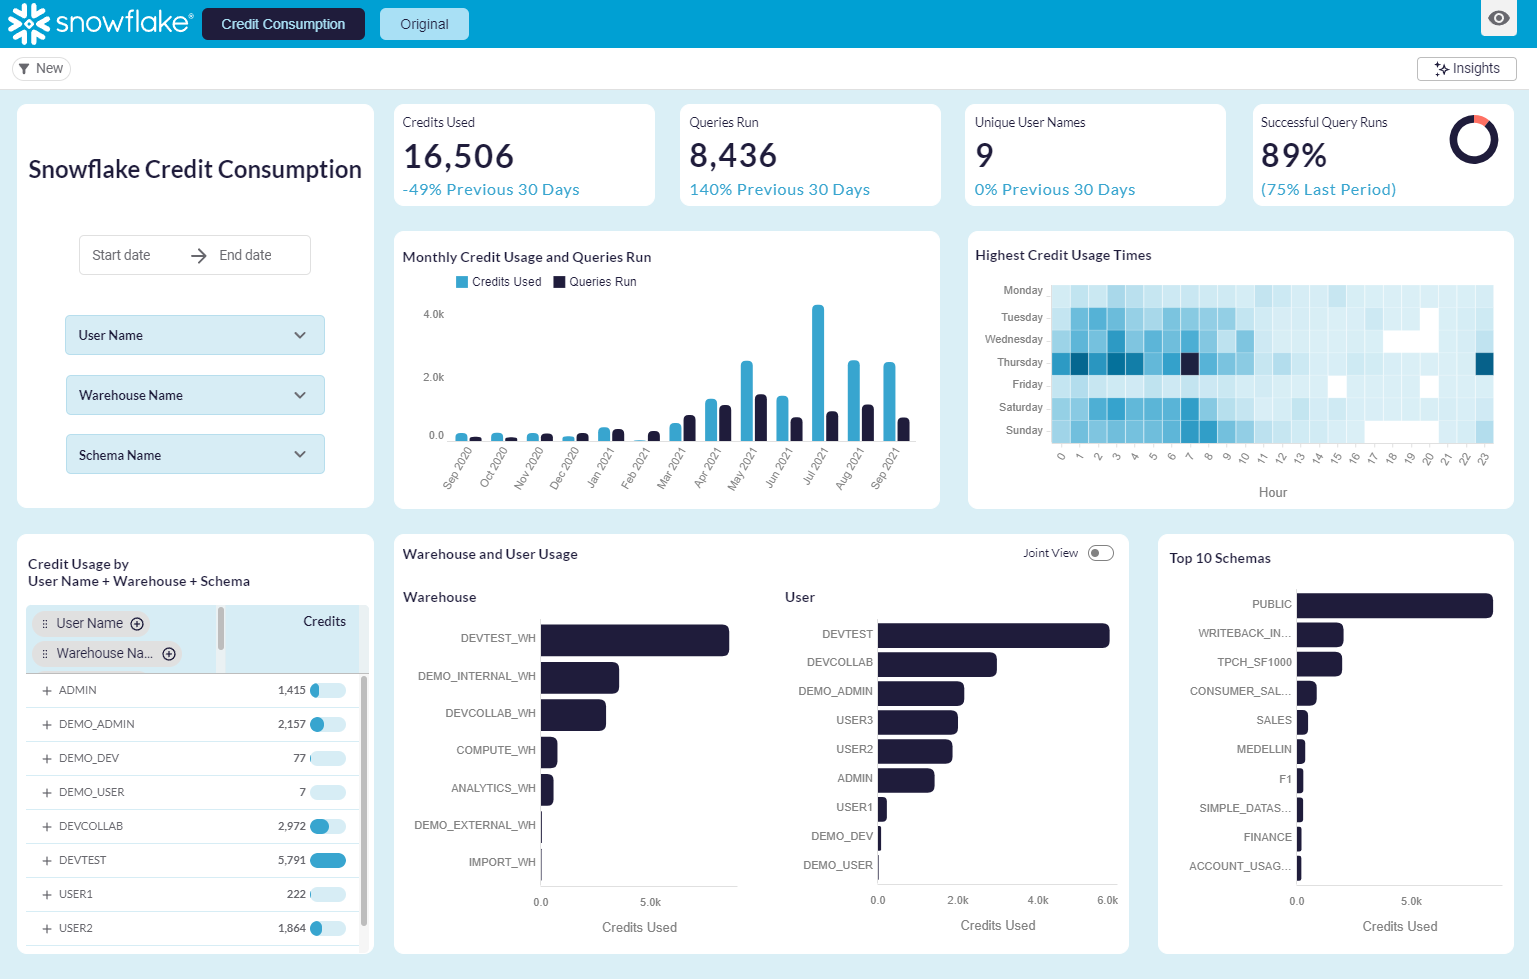
Easily identify hotspots in time using gradient color scales. See the lows and highs of consumption, and filter down for more detail on specific time periods for in-depth insights!