Self-service BI that doesn't mean self-service chaos
Legacy tools promised self-service but delivered dashboard sprawl, ungoverned metrics, and a learning curve that sent business users straight back to the analyst queue.
Astrato gives your data team the governance controls they need – and your business users an experience simple enough to actually use.


Your data team sets the guardrails. Users move freely within them.
Legacy BI gave you a choice: lock everything down and become the bottleneck, or open it up and watch governance collapse. Astrato gives your data team a third option.

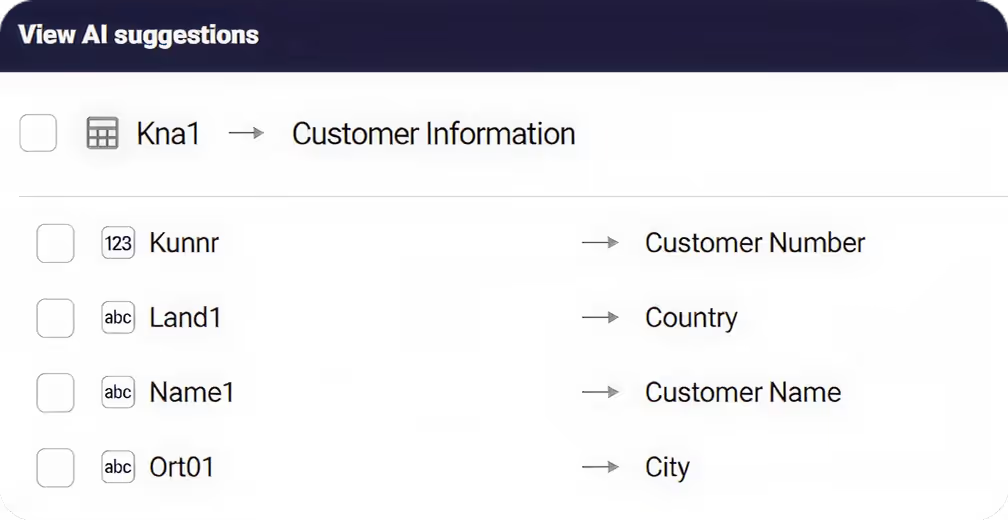
One definition of revenue. Everywhere.
Your Semantic Layer is where the arguments end. Define your metrics, dimensions, and business logic once – and every dashboard, every team, every user pulls from the same source of truth. No more conflicting spreadsheets. No more "where did you get that number?" in the Monday meeting. And when someone does ask, they can inspect the underlying SQL and data lineage behind every visualization.

You're not building dashboards. You're designing experiences.
Actions let you chain together clicks, filters, and navigation into guided flows – no code required. Set default selections, control which objects or measures appear dynamically, and engineer exactly how users move through the intricacies of your data. Instead of handing them a dashboard template and hoping for the best, you design the path. It feels like exploring an app. It works like one too.
Nothing goes live until you say so.
Draft, version, publish. Your team iterates in private, saves stable snapshots, and pushes to end users only when it's ready. Role-based permissions control who sees what and who builds what. Row-level security is inherited from your warehouse or can be set up per Semantic Layer. Governance isn't a layer you add on top, it's the foundation everything else sits on.


Astrato stands out as a remarkably intuitive platform that strikes an excellent balance between flexibility and powerful data analysis capabilities. It enables users to explore and visualize data freely while still maintaining strong analytical depth and precision, so you don’t have to trade ease of use for rigorous insights.

An analytics experience your users won't need training for
Bookmarks

Point-and-click exploration

Dynamic filtering

Executive reports
Custom Report

AI-powered insights


Governed by your warehouse
Astrato queries your warehouse directly – your data never moves. Row-level security and role-based access are inherited from your existing policies, so your team controls exactly who sees what without managing permissions in two places.


Legacy BI bingo. Sound familiar?


Unlock the true power of the cloud with a cloud-native BI platform

Frequently asked questions
How much semantic layer setup does this require before users can actually start exploring?
Less than you'd expect. Astrato can infer relationships from your warehouse schema to give you a working model on day one, and you refine from there. Most teams get their first governed dashboard into users' hands in under a week.
Will our analysts who've spent years building in Qlik or Tableau find Astrato familiar?
Yes — the building experience is closer to PowerPoint than to Tableau's worksheet model or Qlik's scripting editor, so the drag-and-drop workflow feels natural right away. Analysts who wrote complex Qlik load scripts or Tableau LODs take longer to adapt, but most prefer having that logic in one governed Semantic Layer.
Will our business users actually adopt this, or go back to asking the BI team for everything?
Adoption is usually quick because consumption feels familiar — dashboards, filters, drill-downs all behave the way business users expect. Where Astrato stands out is the no-code report builder: users can slice, pivot, and save their own views without going back to the analyst queue for every new question.
How steep is the learning curve for non-technical users?
Gentle. Most users coming from Tableau, Qlik, or Excel need little retraining. The drag-and-drop editor, AI-powered insights, and natural language queries mean business users can explore data and get answers independently. We also provide training videos, a help center, and demo apps to learn by doing.
Why not Sigma Computing embeds?
Modern BI tools improve usability, but still treat embedding as an extension of dashboards.
That means:
- limited control over presentation
- spreadsheet-style UX that doesn’t match most products
- less flexibility in building tailored customer experiences
Astrato lets you design analytics that feel native to your product — not an embedded worksheet.