Customer-facing analytics, built by your product team
Branded, interactive dashboards that query your warehouse directly – embedded in your product or delivered through your portal. Your product team builds it, ships it, and iterates on it. No engineering team required.

From data to revenue
Your customers pay for your data – but if they're accessing it through spreadsheets and static exports, you're making it easy to commoditise what you've spent years building. Astrato turns your data into a live, branded analytics experience your customers will pay more to keep.
Building analytics in-house means diverting sprints from your core product – and it still takes months. Astrato lets your product team ship branded, interactive dashboards without engineering dependency.


We use Astrato for its BI capabilities, embedding, and easy data delivery to users. It simplifies complex data into a simple format for our end users. I also find the product to have a pretty low learning curve, making it easy for us to get in and understand it quickly.
.svg)
Built on your warehouse. Branded as your product. Live in weeks.
Your data never leaves
Every query hits your cloud warehouse directly. If you've already configured row-level access, PII masking, or audit trails — they carry over automatically. If you haven't, Astrato lets you set up flexible security policies without touching your warehouse. One dashboard, hundreds of customers, each seeing only what's theirs.

Your customers won't know we exist
That's the point. Your colors. Your fonts. Your app feel. Analytics embedded inside your product, portal or hosted on your customer URL and authenticated through your SSO. When your customers filter, drill down, or write data back, they're doing it inside an experience that looks and feels entirely yours.


The product team ships it, not engineers
Most in-house builds take 6–18 months and a dedicated engineering team. Astrato puts your product or analytics people in control instead. Define your metrics once, build a dashboard, templatise it, deploy across tenants in weeks. Customer wants a new view? Ship it in days. Deal depends on a custom cut? Your sales engineer builds it before the next call.
.svg)


When analytics is the product, security is non-negotiable
Your customers need to know their data is isolated and their access is governed – and that your infrastructure will pass their security review. Astrato inherits the security and authentication policies already in your warehouse, so you do it well once and won’t need to rebuild access controls in a second platform.


Dashboards your customers can work in
Your customers can update records, input data, annotate insights, and trigger approvals – directly from the embedded dashboard, written back to your warehouse in real time. For data businesses, that's the difference between a reporting tool customers check weekly and an operational layer they can't work without.
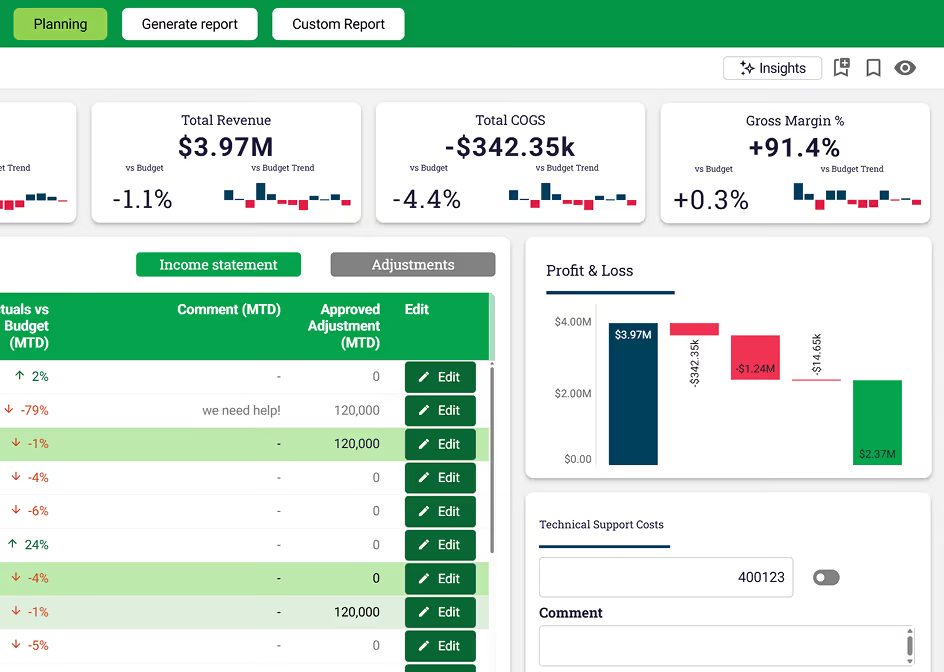
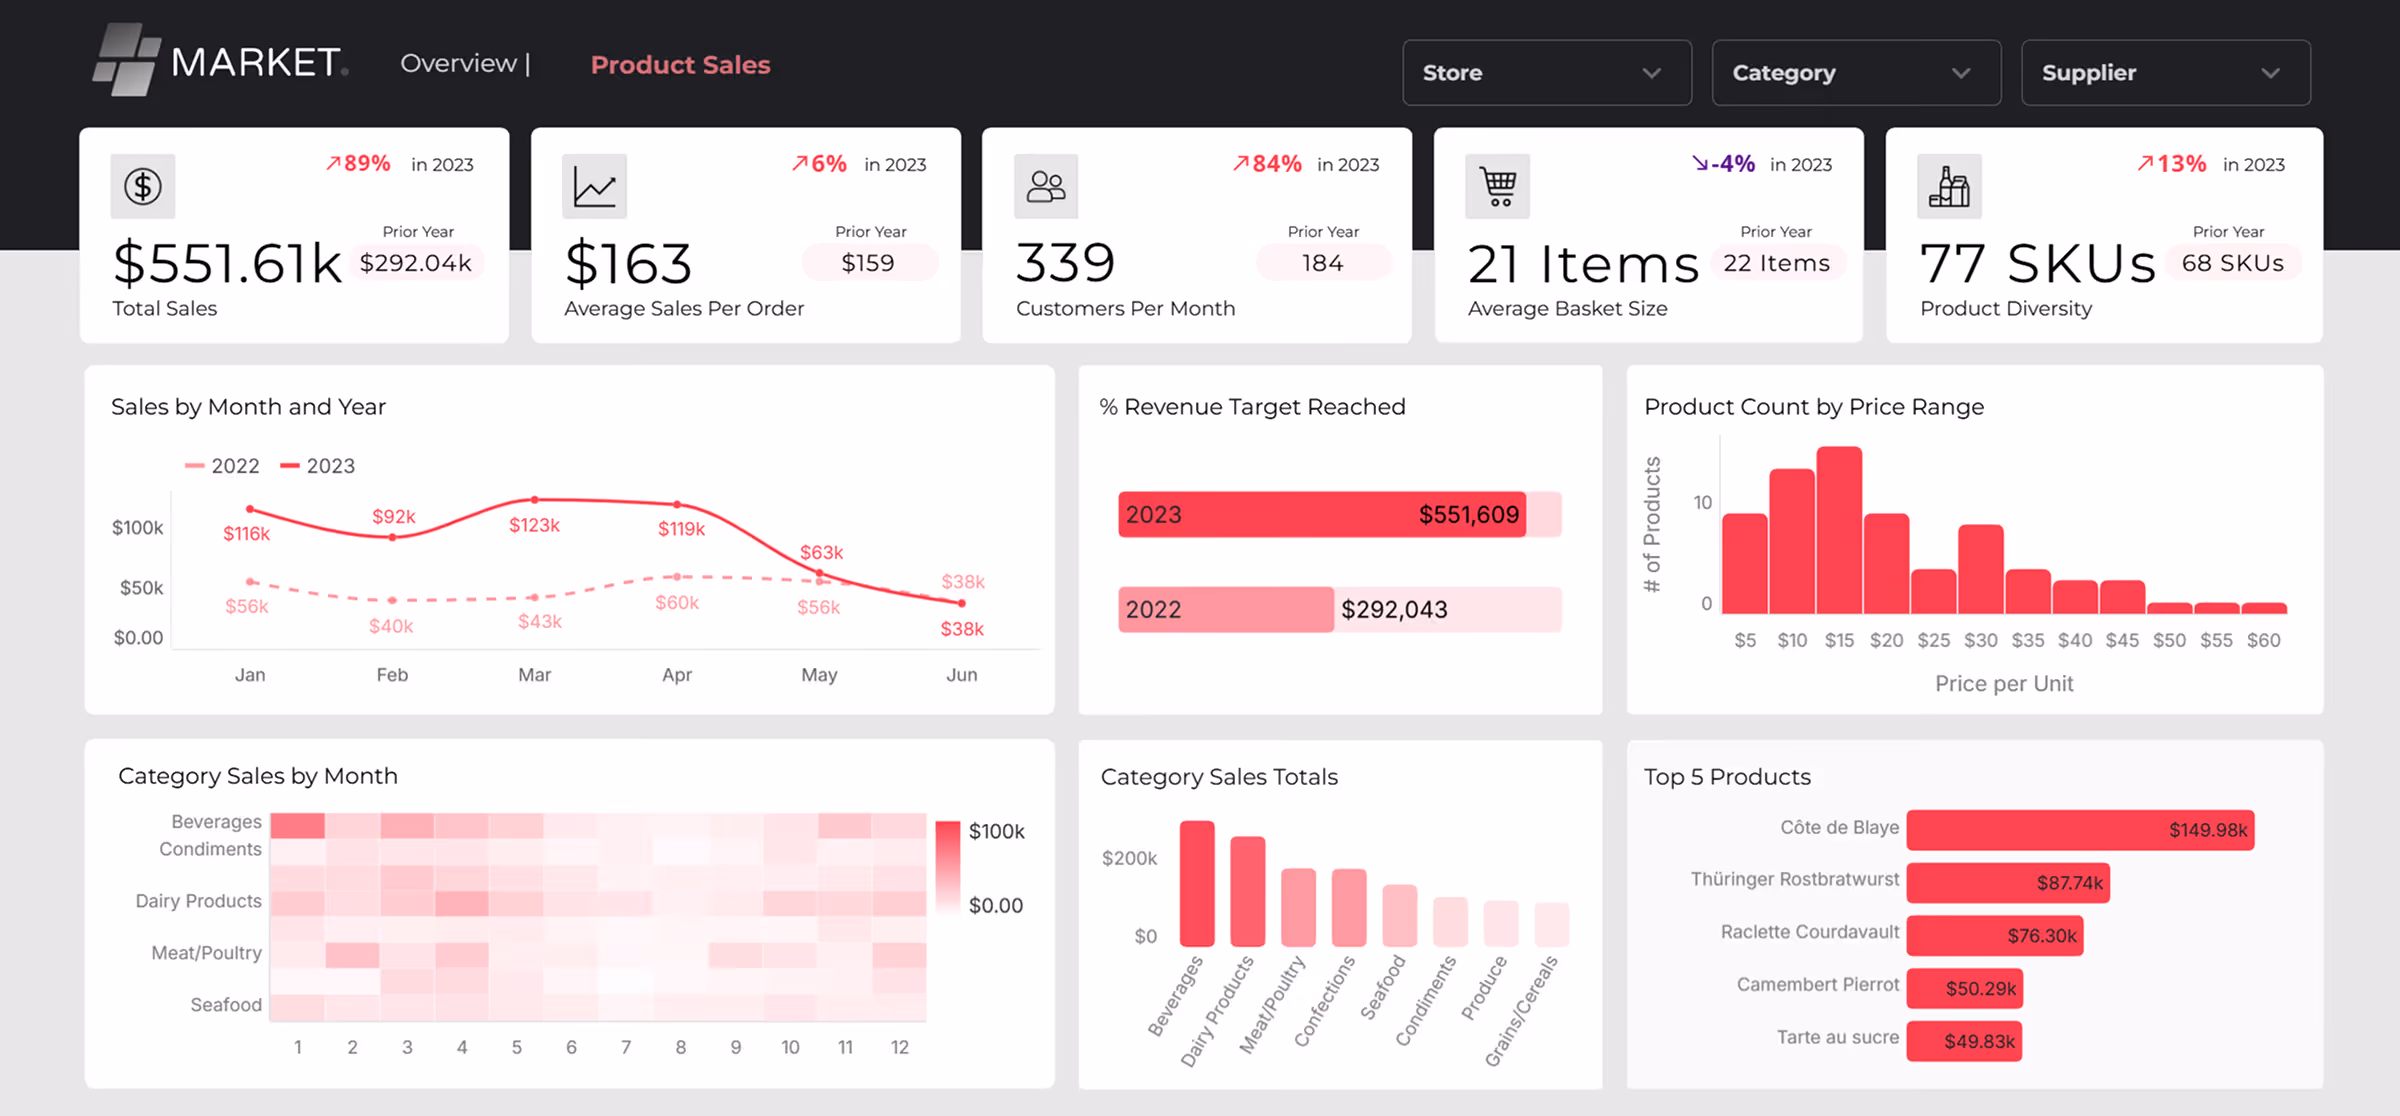
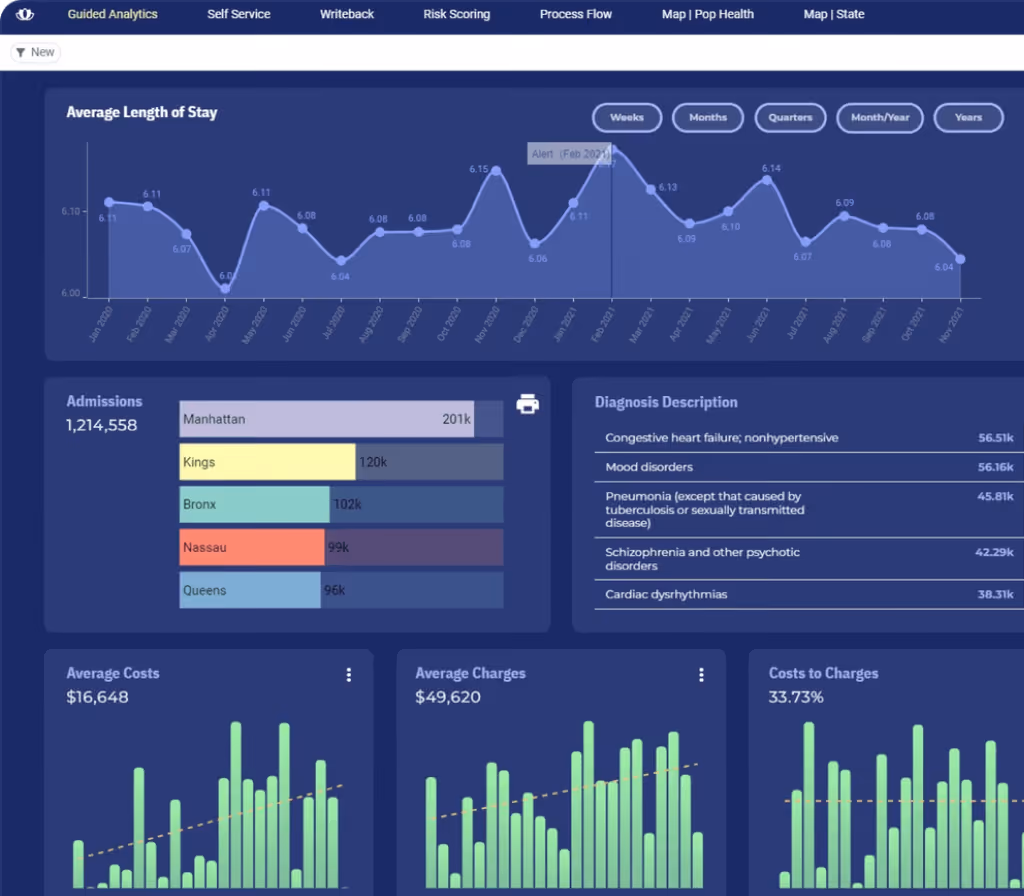
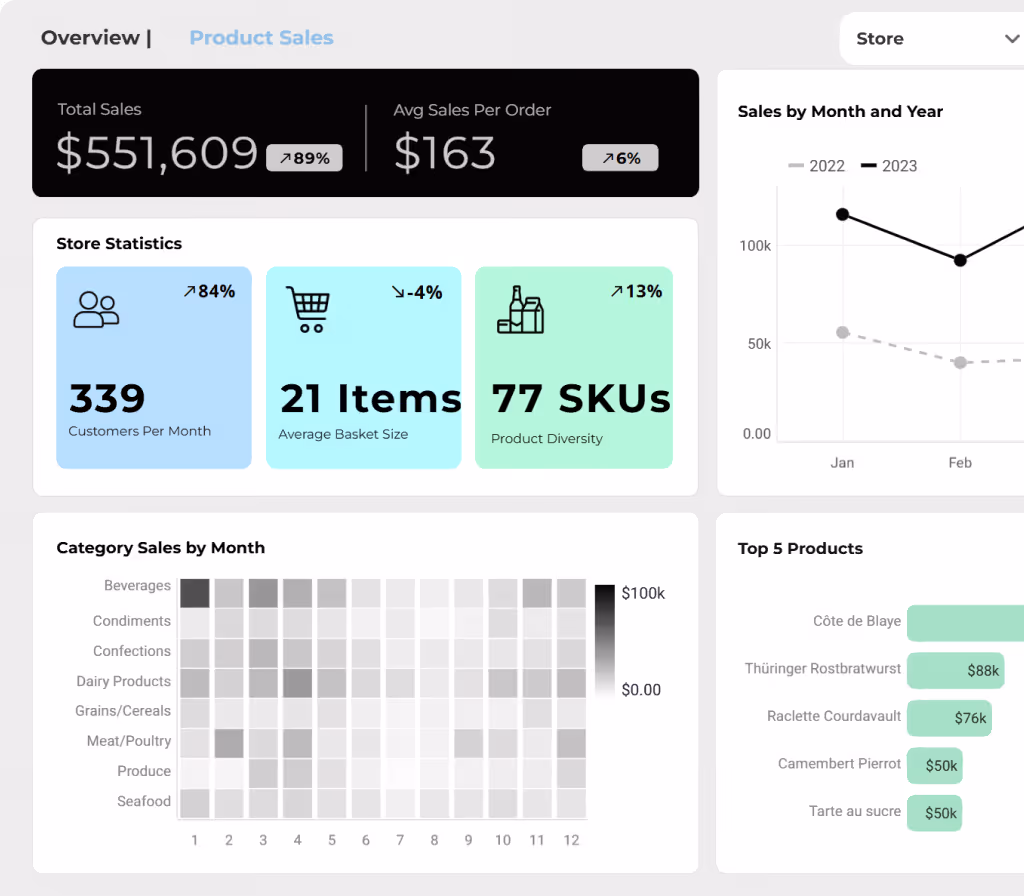
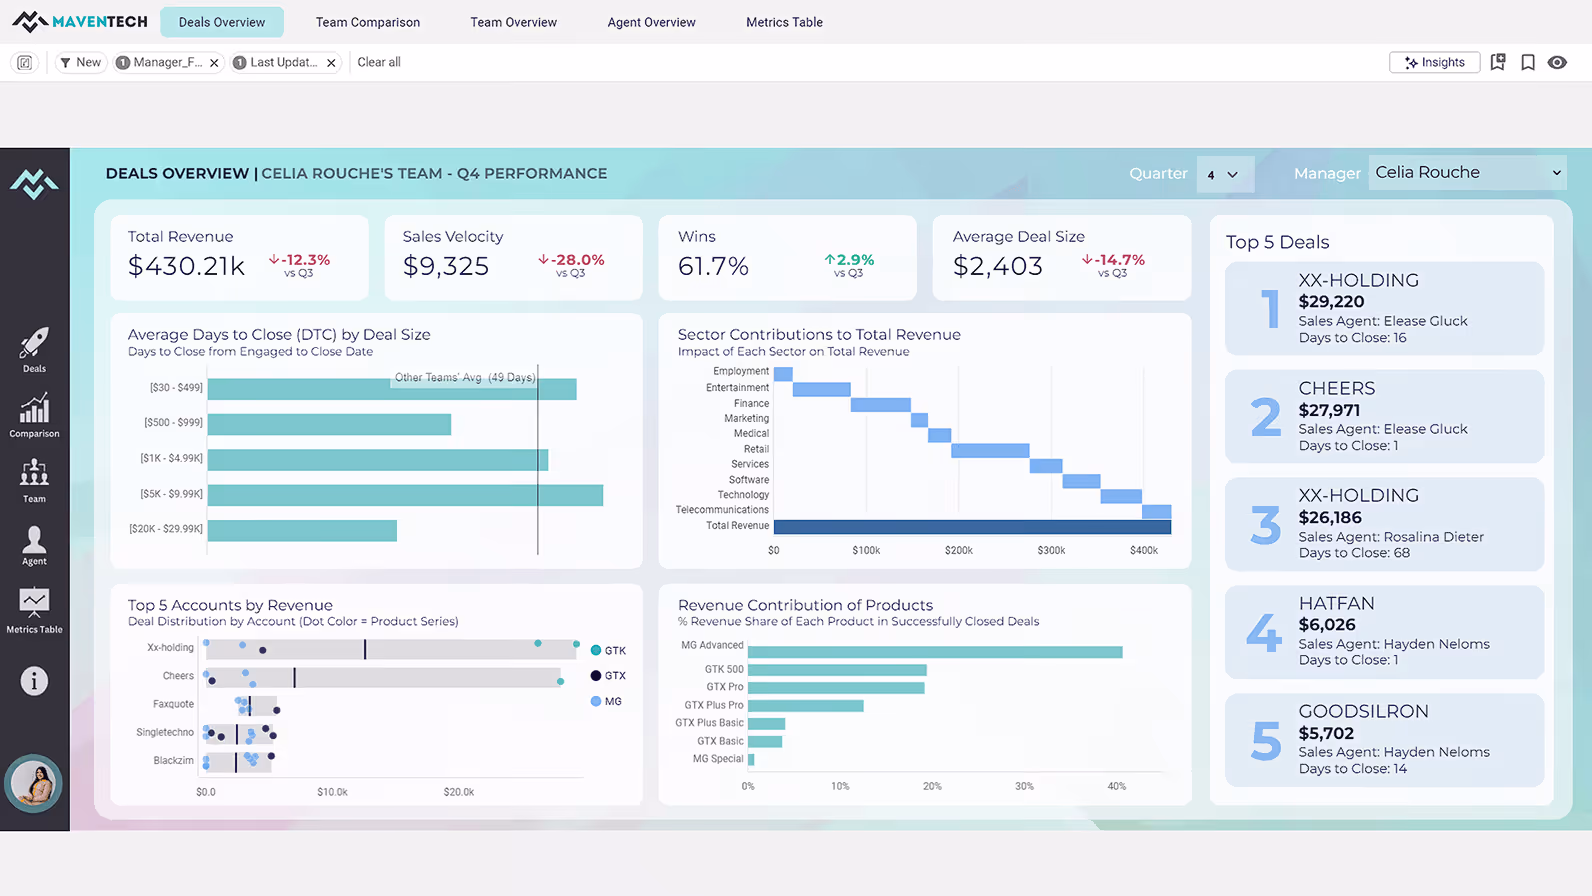
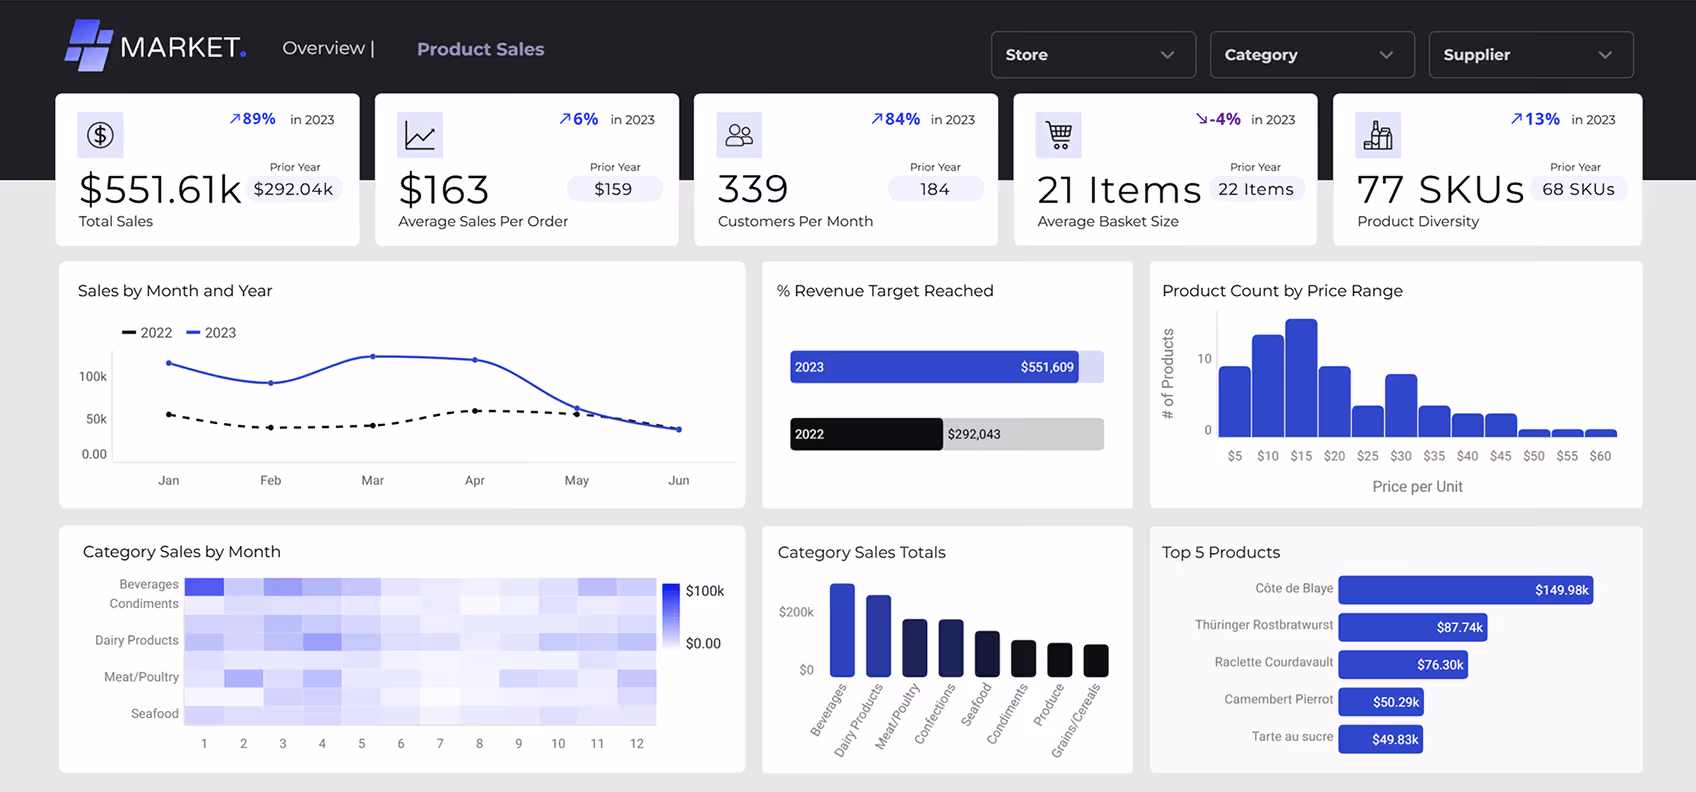
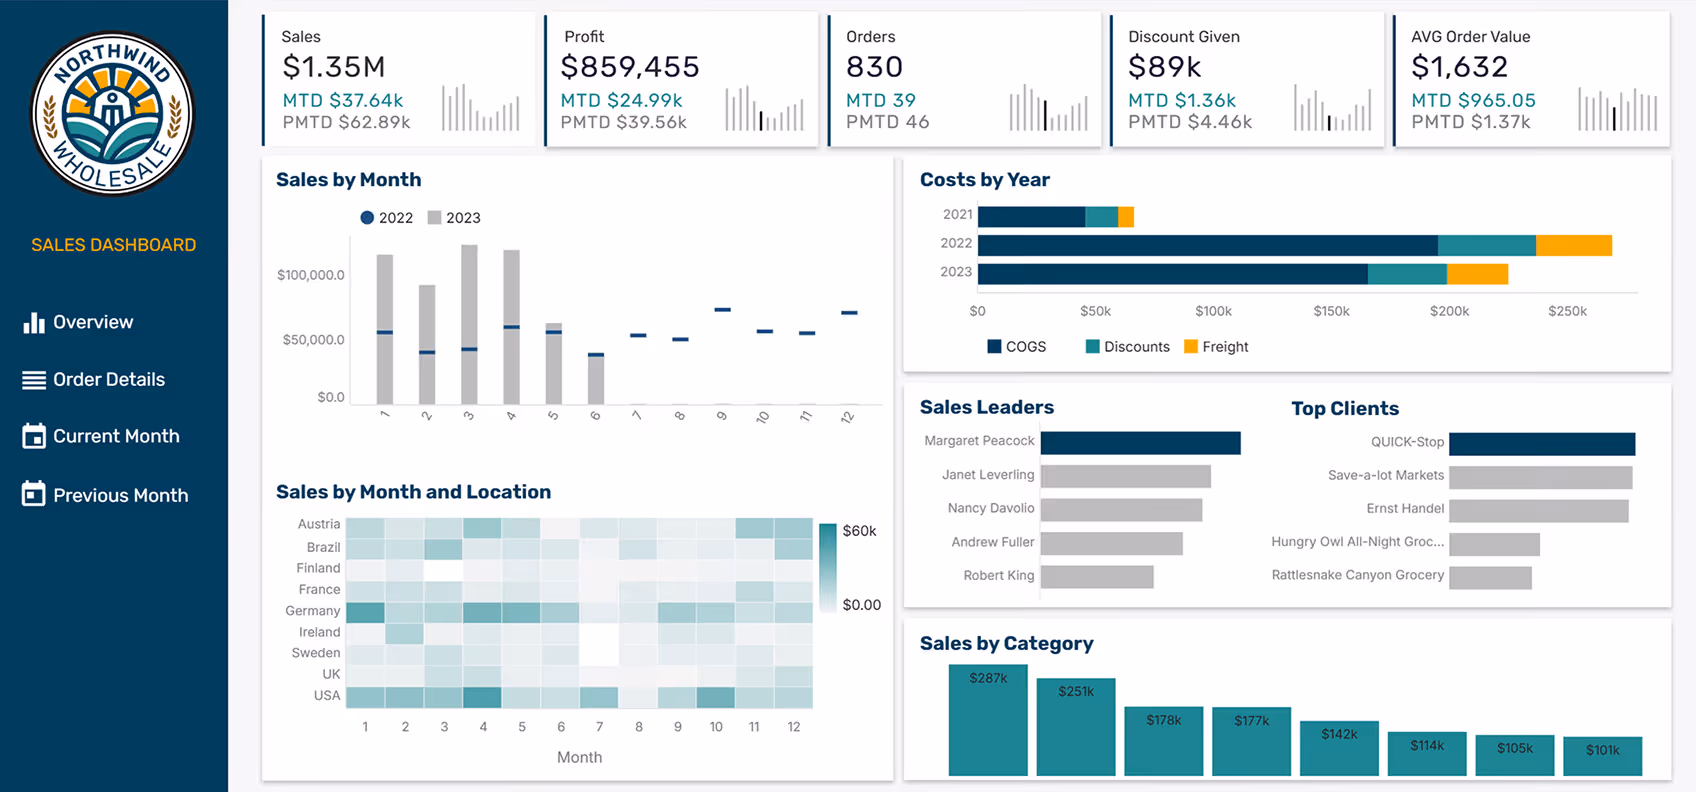
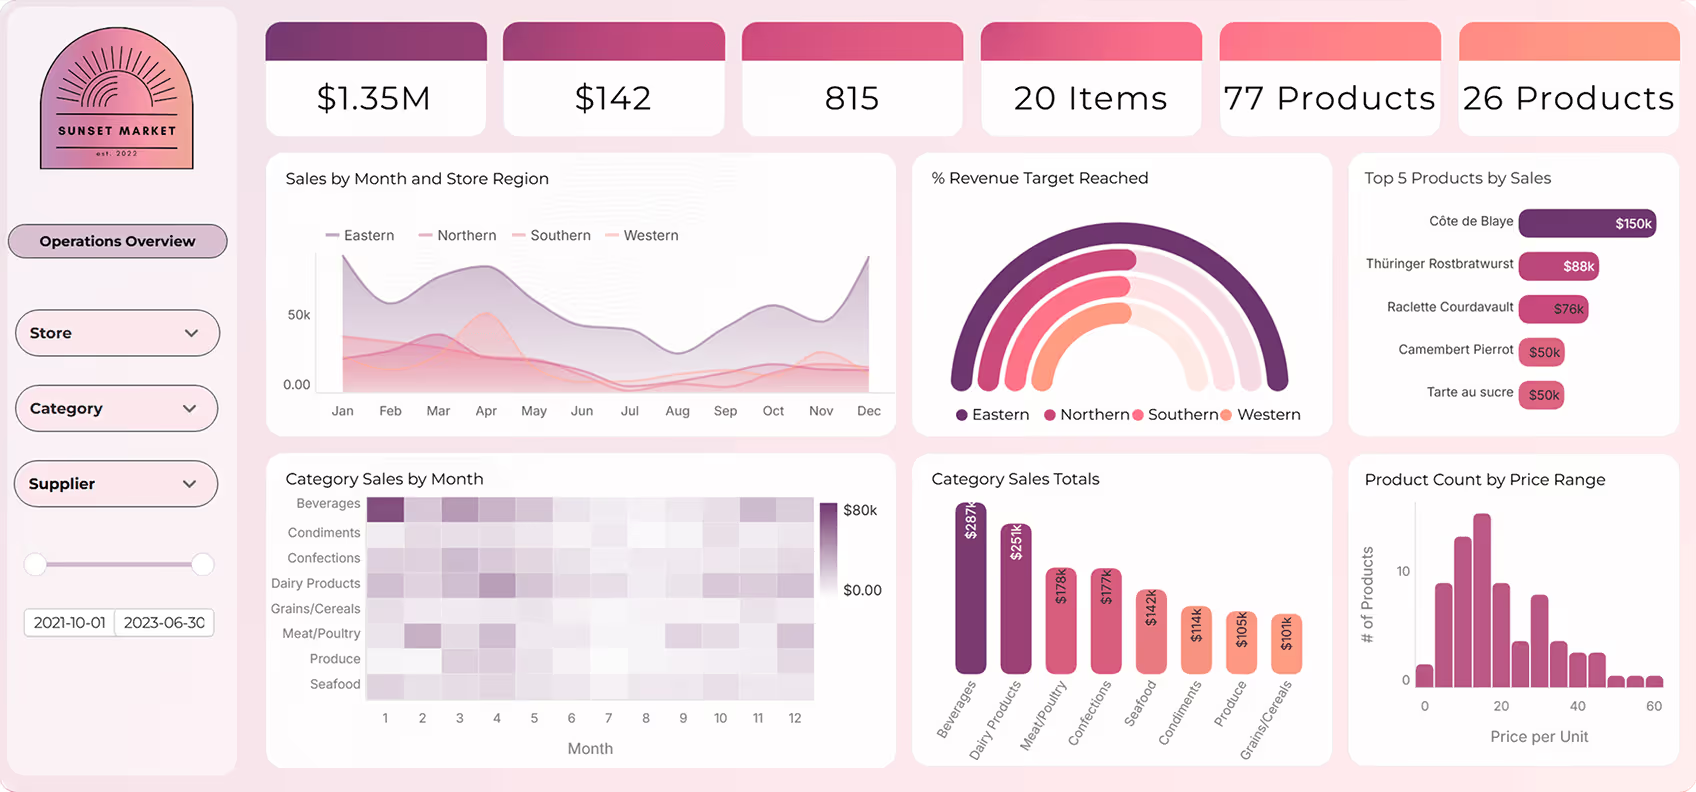
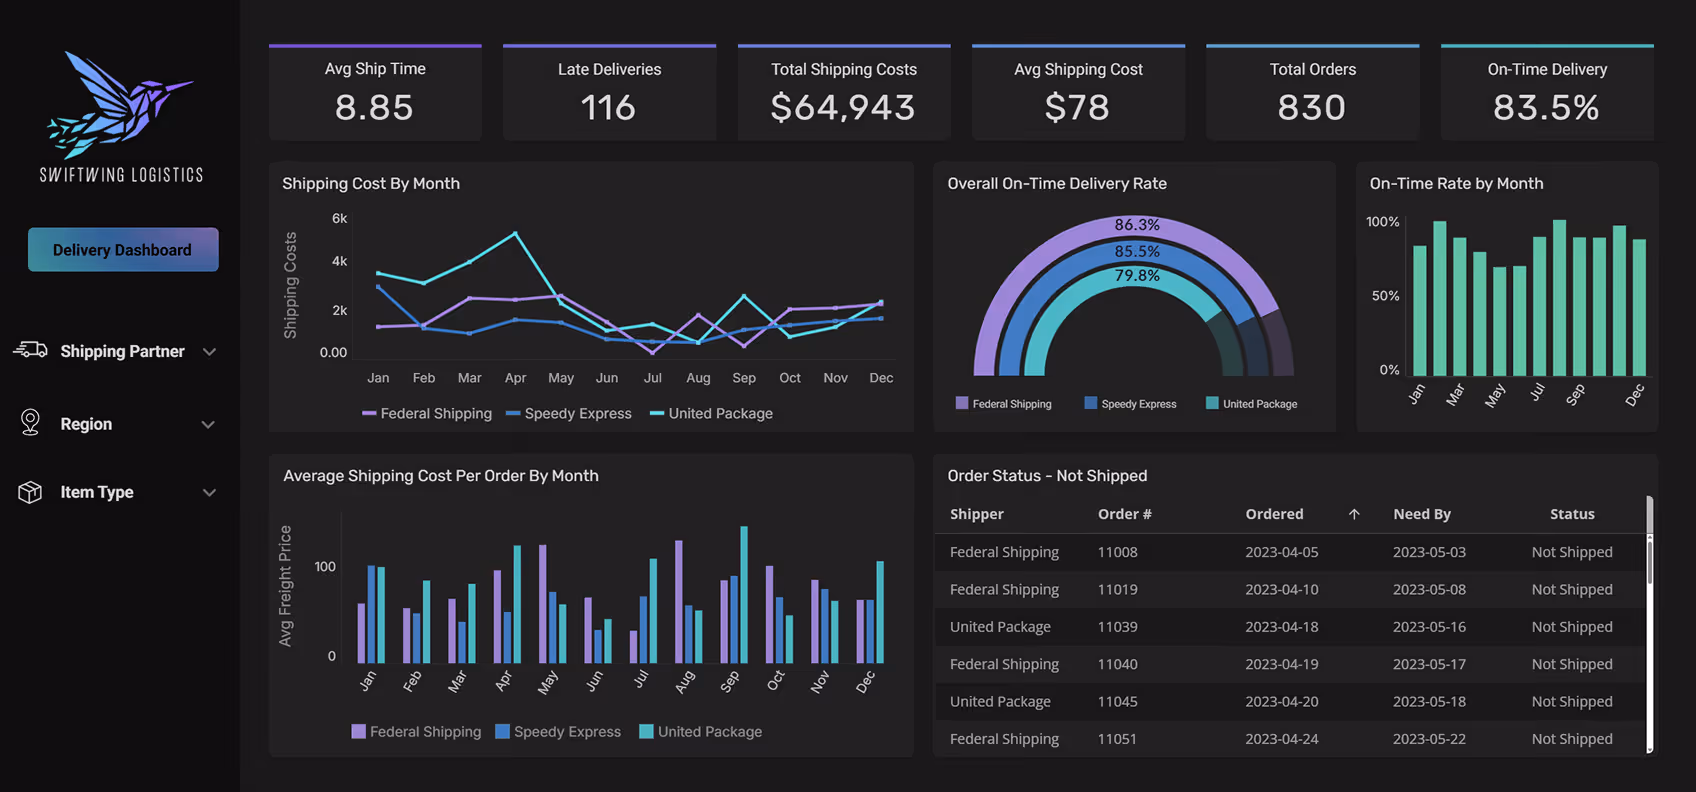
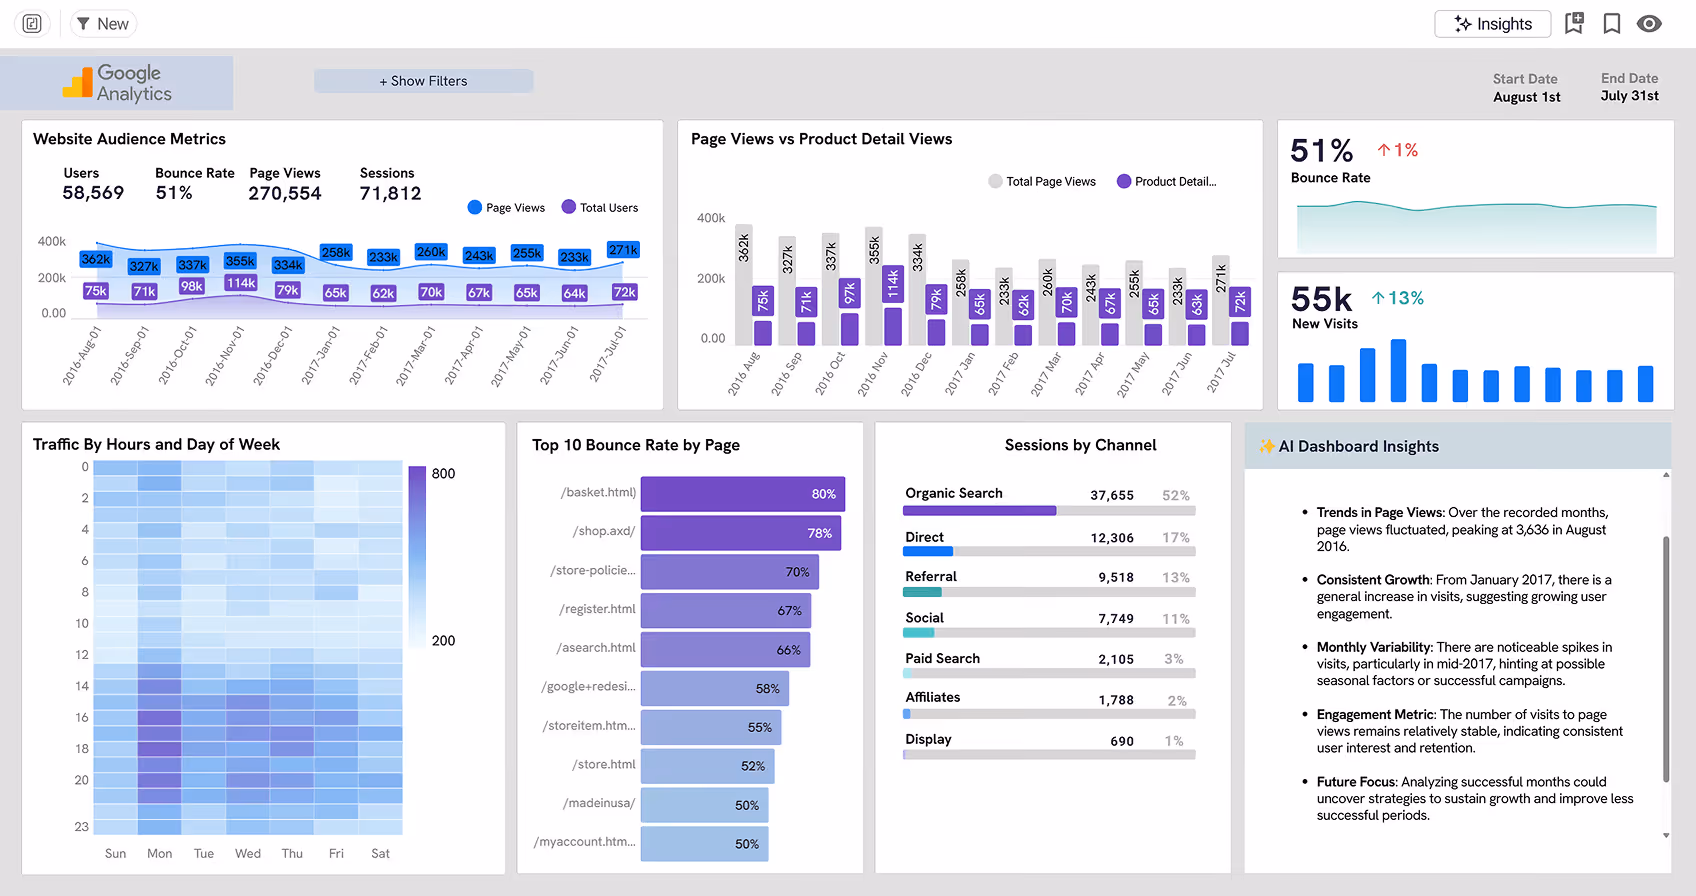
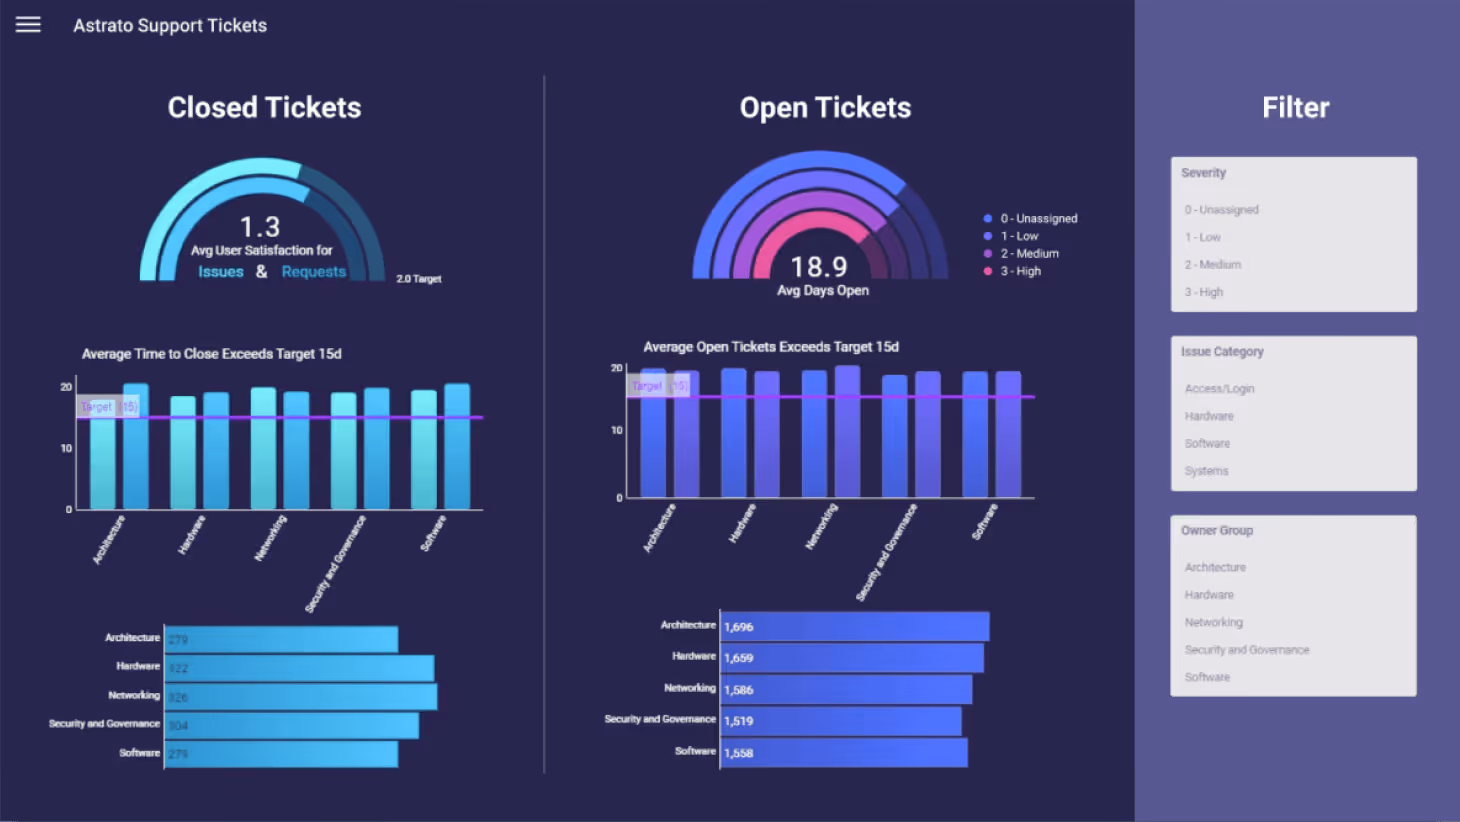
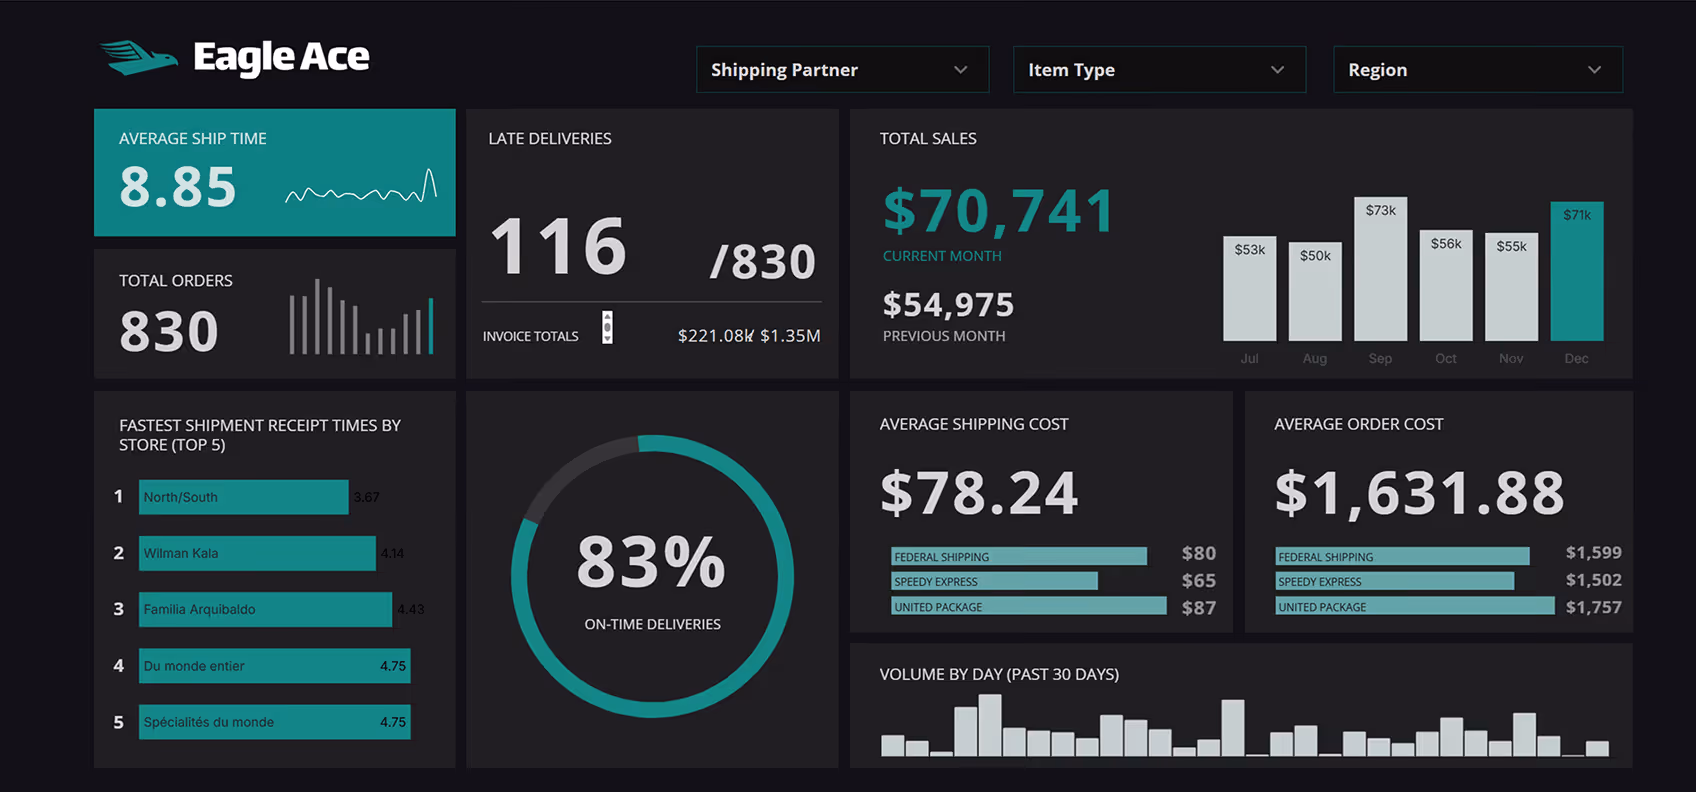
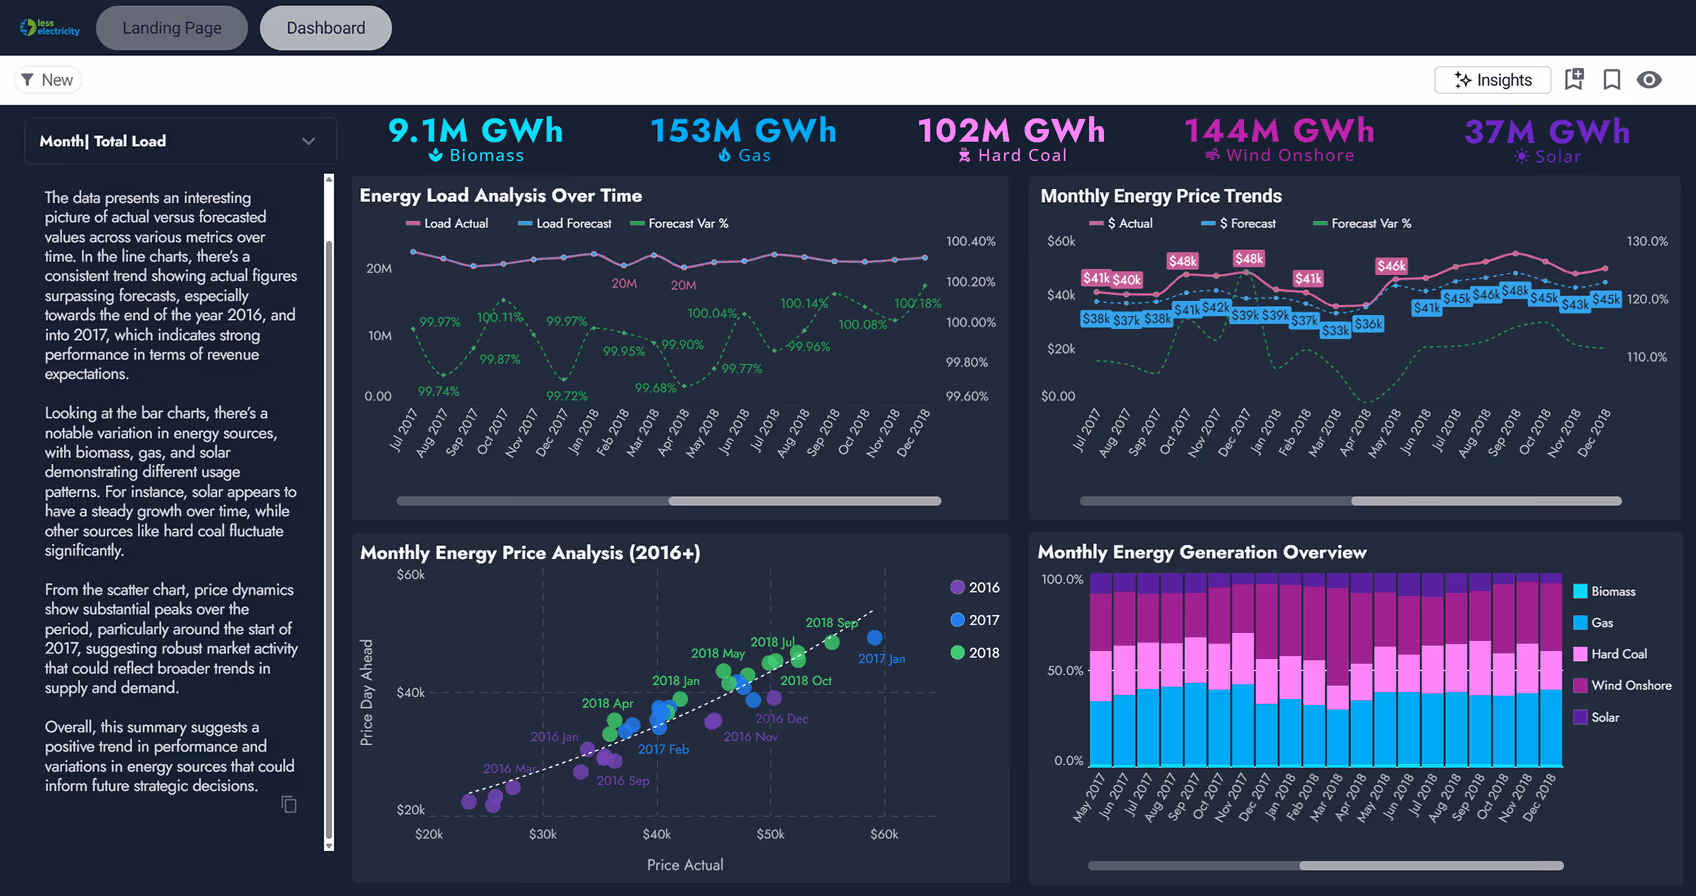
See what your customers will see

Frequently asked questions
What happens to our Snowflake/BigQuery bill when thousands of customers start hitting embedded dashboards?
Every user interaction fires a live query, so warehouse usage does grow with engagement — but predictably. Astrato generates optimized SQL and uses your warehouse's native caching, so repeated views of the same data don't recompute. For heavy workloads, pre-aggregating at the warehouse level keeps costs flat even at scale.
Can our customers build their own views inside the embed, or only consume what we ship?
Both, depending on setup. Out of the box, end users can filter, drill down, and save personal bookmarks. If you want to go further, enable a curated report builder so customers create their own views from pre-approved fields — without breaking governance or seeing each other's data.
How does Astrato handle multi-tenancy so each customer only sees their own data?
Each customer session inherits the row-level security policies already defined in your warehouse, or you can configure them directly in Astrato. One dashboard template serves every customer; the filters and permissions applied at login make sure they only see what's theirs.
How do customers authenticate — do they need a separate Astrato login?
No. Customers log into your product as they always have, and Astrato inherits that identity through JWT web tickets, SSO, Auth0, Okta, or SAML. No second login, no separate credentials. Your authentication flow stays untouched, and the embedded analytics just work for whoever's already signed in.
How does pricing work for external customers — do we pay per user?
No, external users aren't priced differently from internal ones. Astrato supports named users, consumption-based pricing, or a hybrid of both. For SaaS products with thousands of end users, consumption pricing usually makes the most sense — you pay for active minutes, not seats.
Why not Sigma Computing embeds?
Modern BI tools improve usability, but still treat embedding as an extension of dashboards.
That means:
- limited control over presentation
- spreadsheet-style UX that doesn’t match most products
- less flexibility in building tailored customer experiences
Astrato lets you design analytics that feel native to your product — not an embedded worksheet.