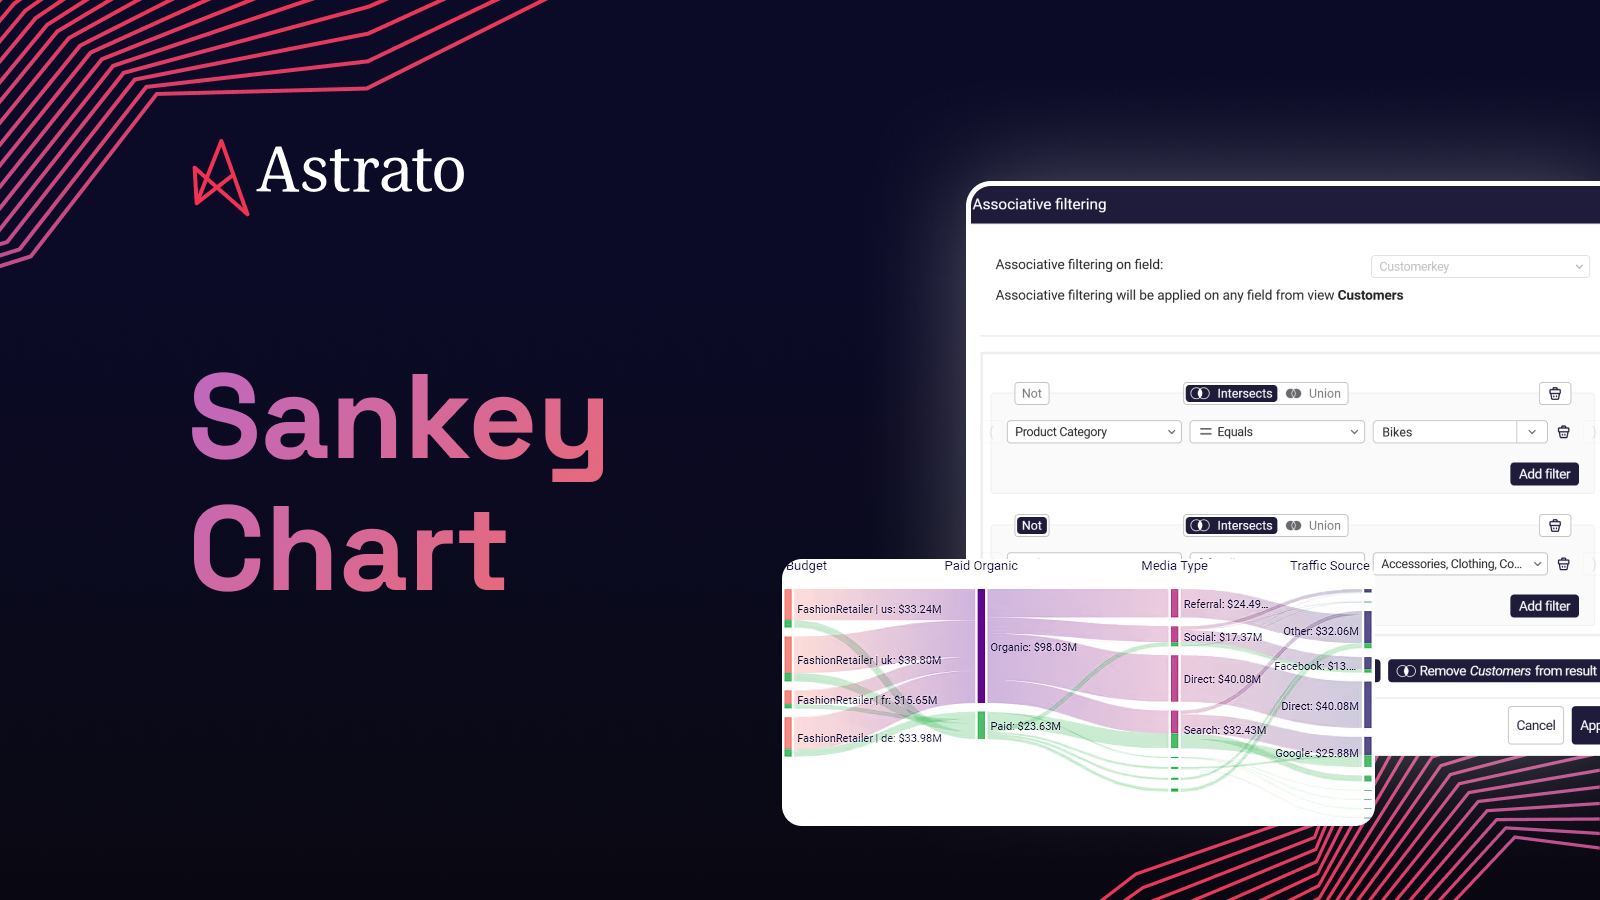
A practical guide to Sankey charts in BI — use cases that justify one, when a bar chart wins instead, and why live-query Sankeys matter for operational workflows.
Did you know you can add Snowflake GenAI Insight Summaries powered by Snowflake (and table/view reporting) to Slack & Teams, directly using Snowflake?
Snowflake’s powerful platform is architecturally different from almost every traditional database system and cloud data warehouse. Snowflake has completely separate compute and storage, and both tiers of the platform are near-instantly elastic.
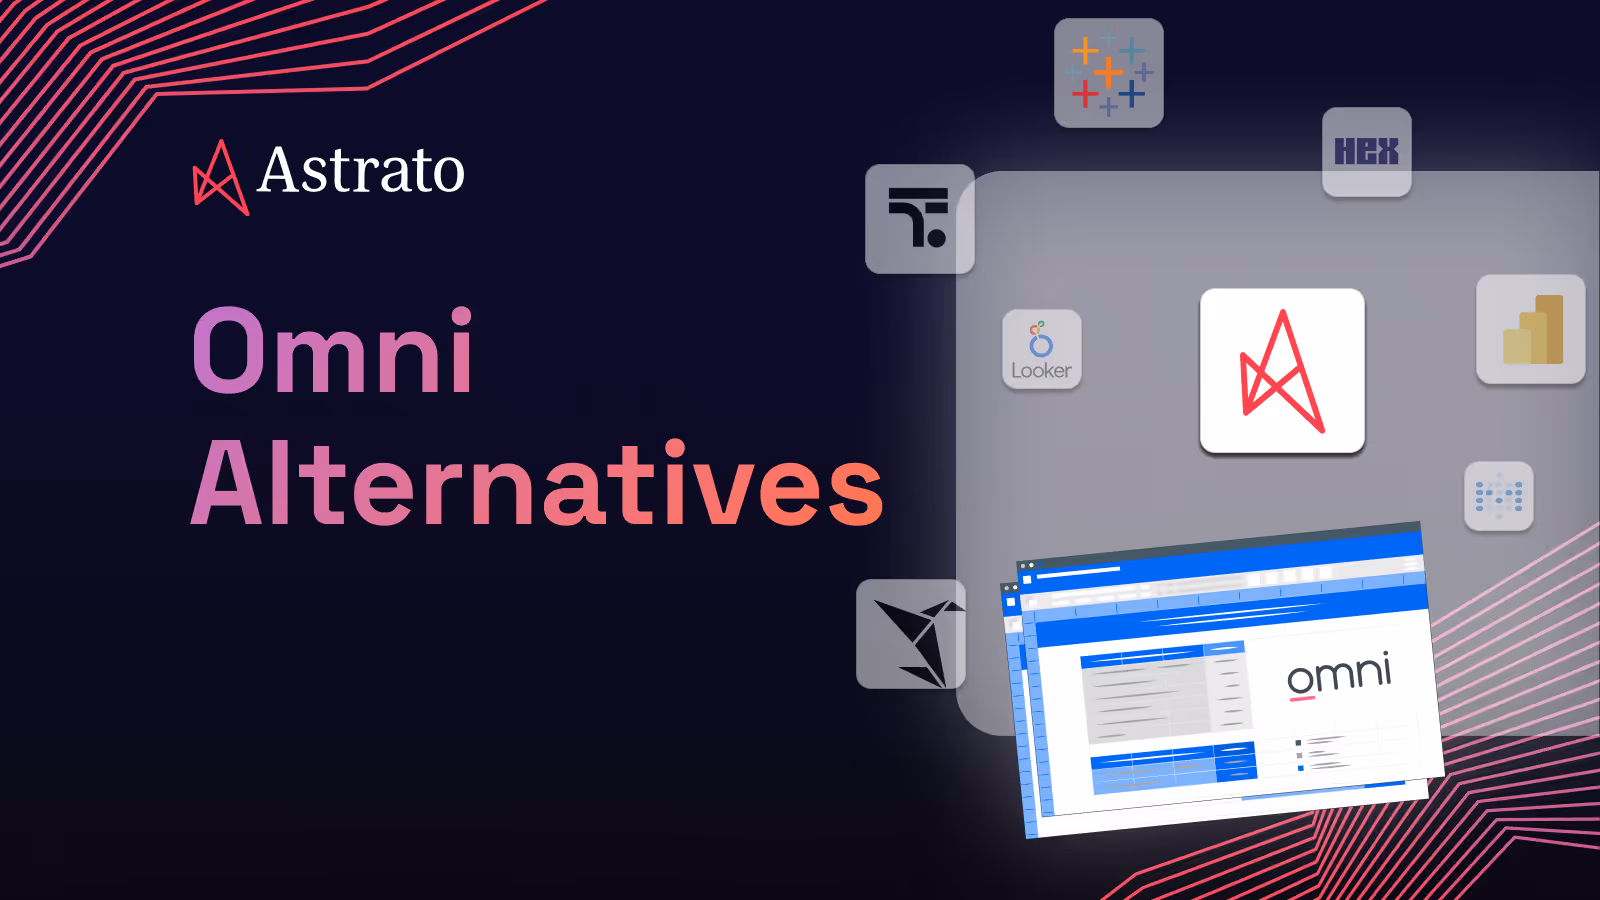
Looking for Omni Analytics competitors in 2026? Compare the 8 best Omni Analytics alternatives including Astrato, Looker, Sigma, and Hex for modern BI.
Looking for ThoughtSpot competitors in 2026? Compare the 9 best ThoughtSpot alternatives including Astrato, Power BI, Tableau, Sigma, Hex, and more.
Spreadsheet sprawl is the hidden tax on FP&A: forked models, version chaos, formula errors, no single source of truth. What it costs and how to escape it.
The month-end close process step by step — reconciliation, consolidation, and sign-off — plus a checklist, challenges, and how finance teams close the books faster.
Databricks AI/BI now embeds dashboards externally. So when do you still need a third-party platform? A decision guide for data platform teams.
Compare embedded analytics platforms for BigQuery — Astrato, Sigma, Looker, Looker Studio, Power BI, Metabase. Built for product teams in Slack.
Self-service BI keeps breaking. Guided self-service fixes it: the data team designs the path, business users move freely within it. Here's how.
Every BI vendor claims self-service in 2026. A four-level spectrum, five evaluation questions, and an honest comparison of the platforms that compete on Snowflake.
How finance teams build a budgeting and forecasting data app on Snowflake — governed inputs, writeback to Snowflake tables, and Snowpark/Cortex forecasting, all on live data.
Finance analytics workflows turn reporting, budgeting, and forecasting from manual spreadsheets into automated processes. Real examples, use cases, and best practices.
A semantic layer is the translation layer between raw warehouse data and the tools people use it in. Learn how it's built, and why it matters.
Examples of data apps — from finance and sales to operations, forecasting, and embedded analytics. See real interactive data apps and what each one does.
Dashboard vs data app: a dashboard lets you see your data; a data app lets you act on it. Compare the two across different use cases and when to use each.
A data analytics workflow turns raw data into decisions. Learn the stages, see best practices, and why the most effective workflows don't end at a dashboard.
A data app turns a read-only dashboard into a governed interface where business users act on live warehouse data. See how they work and real examples.
Dashboards show you what's happening. Data apps let you act on it without switching tools. What that means for your BI stack — and how to know you're ready.
Qlik Cloud is a real infrastructure upgrade. But the architecture underneath is unchanged. Here’s an honest read of what it fixes — and what it doesn’t.