NYC Gun Violence
NYC Gun Violence
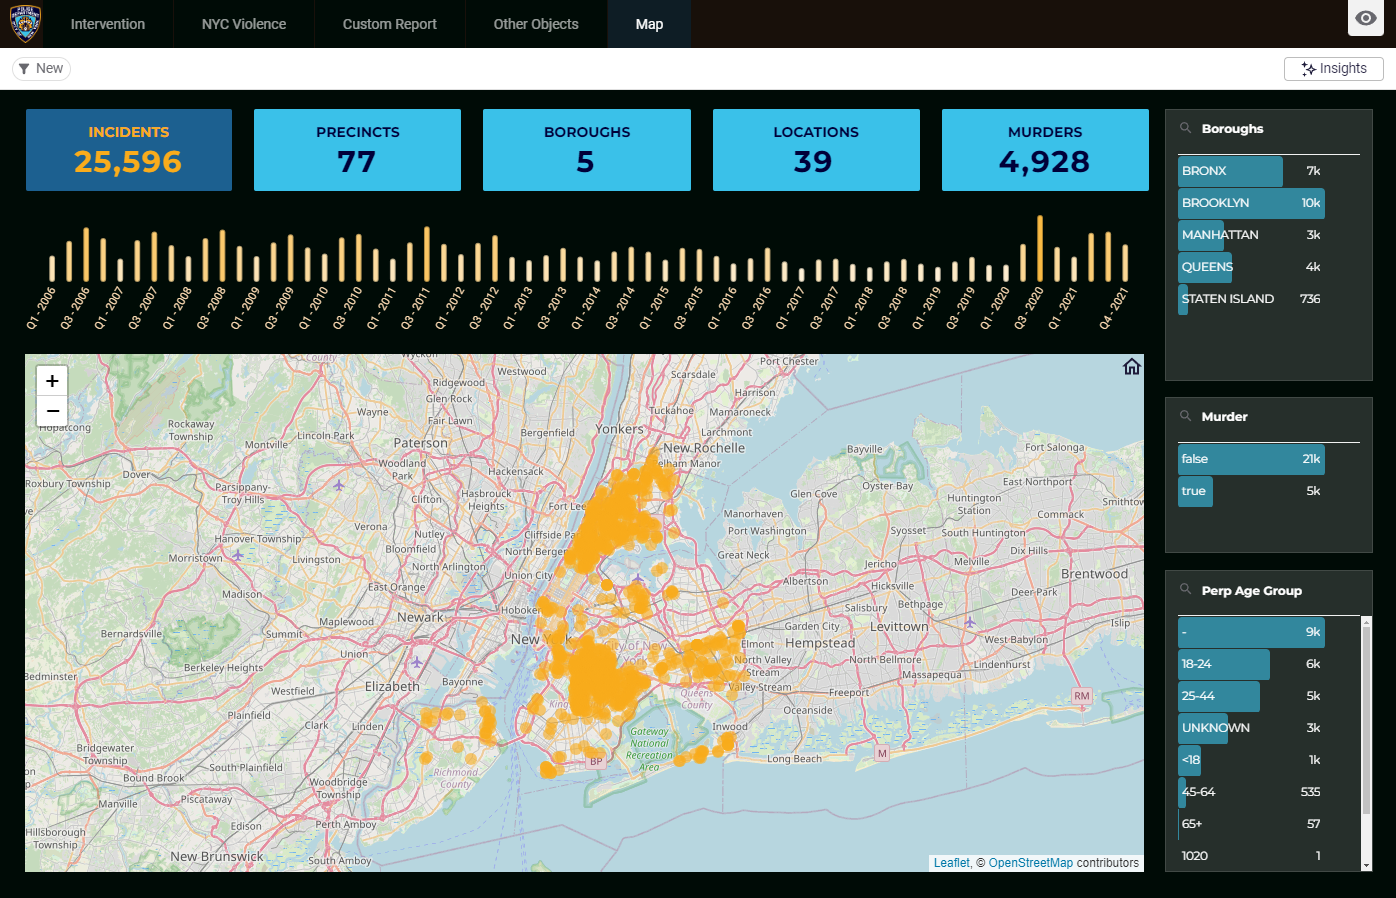
This comprehensive dashboard offers a real-time overview of gun violence trends across New York City, integrating advanced analytics with the Astrato custom report for nuanced policy and security analysis. Designed for policymakers, law enforcement, and researchers, it features a highly interactive map highlighting hotspots and patterns of gun-related incidents throughout the city. Users can delve into detailed statistics, such as incident frequencies, time-based trends, and demographic data of affected populations.
The dashboard’s intuitive interface allows for easy navigation between different data sources, including direct feeds for recent incidents and historical comparisons. With the inclusion of the custom report, users gain access to an in-depth analysis of gun trafficking patterns, helping to identify potential sources and routes of illegal firearms entering the city.
Key features include:
- Dynamic Heatmap: Visualize gun violence hotspots in real time, with the ability to drill down to neighborhood-level details.
- Trend Analysis: Examine how gun violence metrics evolve over time, with filters for date ranges, specific events, and legislative changes.
- Demographic Insights: Understand the impact of gun violence on different communities, including age, gender, and ethnicity breakdowns.
- Policy Impact Analysis: Assess the effectiveness of current policies and regulations on reducing gun violence
This dashboard not only serves as a critical tool for monitoring and responding to gun violence but also as a foundation for informed decision-making and policy development in New York City.
 Numbers
  Bar Charts
  Line Charts
  Combo Chart
  Map
Map