Branded reports that build themselves
And land where your stakeholders already work.
Executives want formatted reports. Clients want branded updates. Compliance needs a paper trail. And somehow, it's your data team building all of it by hand.
Astrato automates the entire cycle – from live data to personalized, formatted reports delivered to email, Slack, Teams, and SharePoint – so your team can stop being a report factory and start being a data team again.


Create & distribute paginated reports at scale
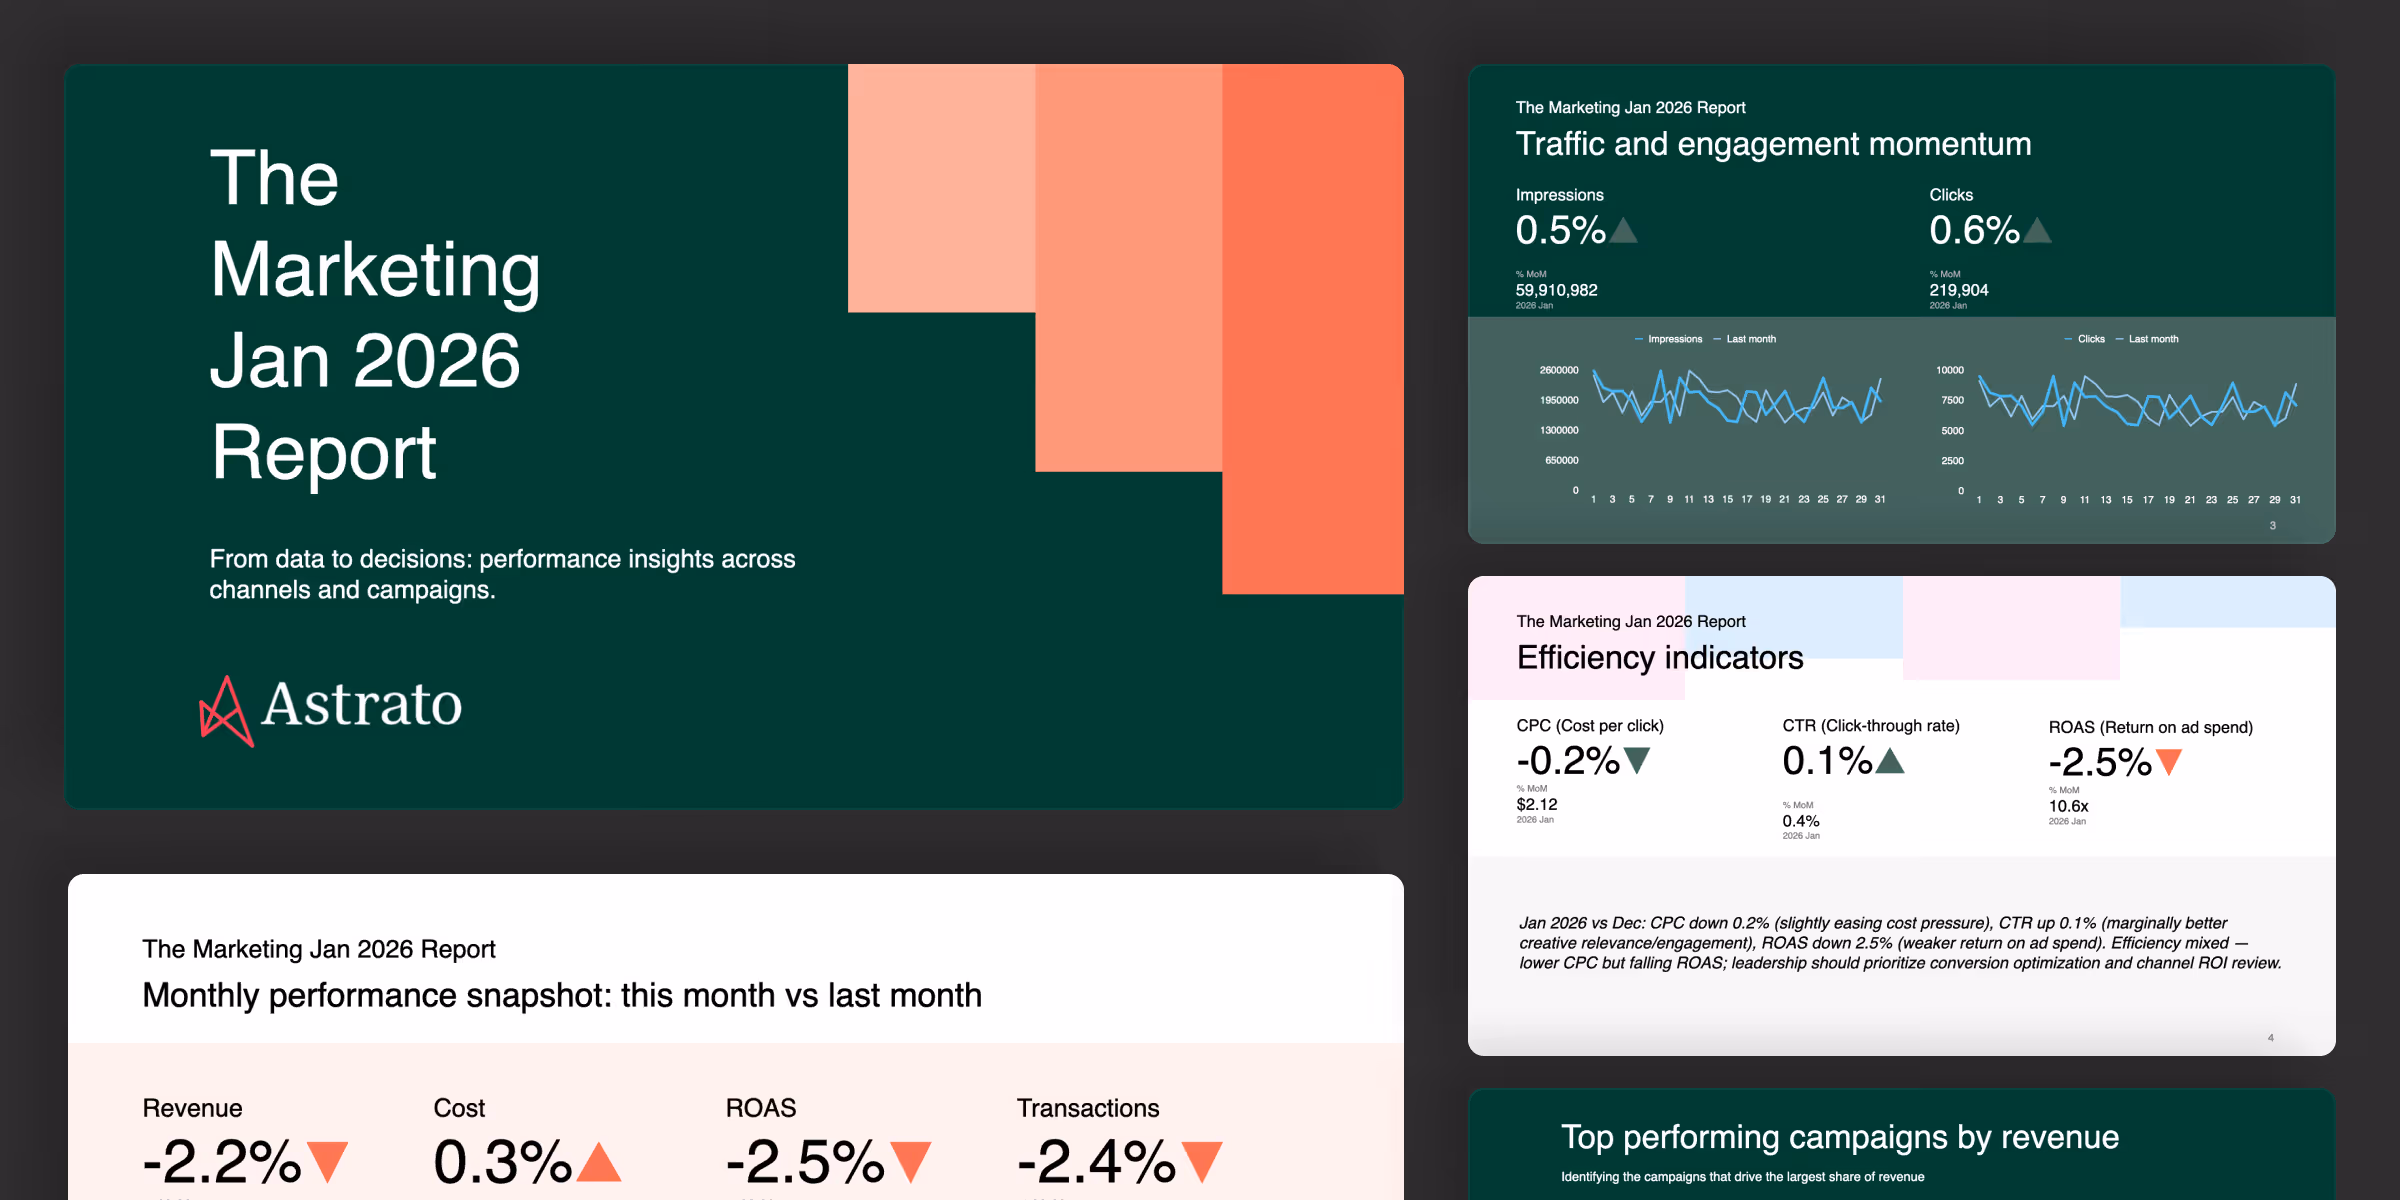
Every week, the same ritual: pull the numbers, format the slides, email the PDF. Astrato lets you design a report once – in your own Excel or PowerPoint template – and populate it with live warehouse data. Charts update. Numbers refresh. Every recipient gets a personalized version, scheduled and delivered automatically.
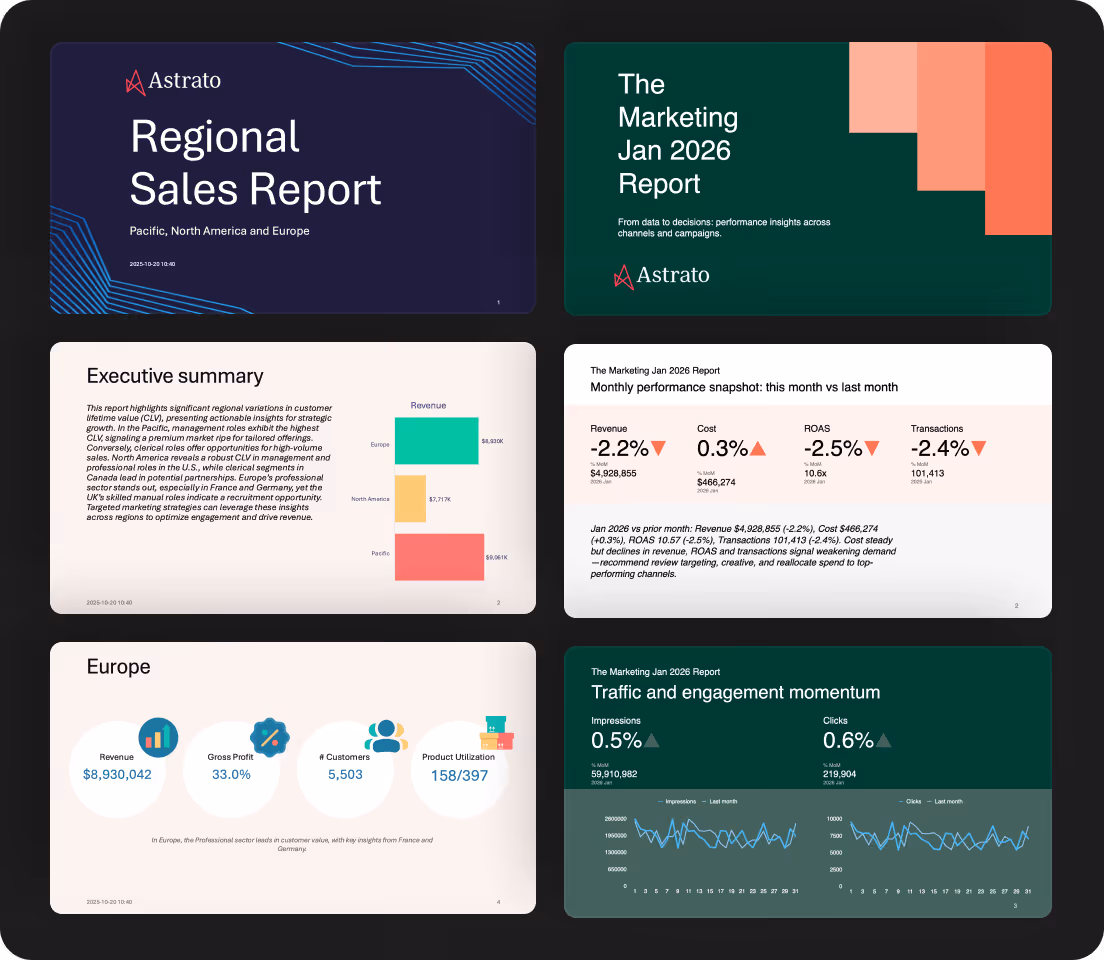
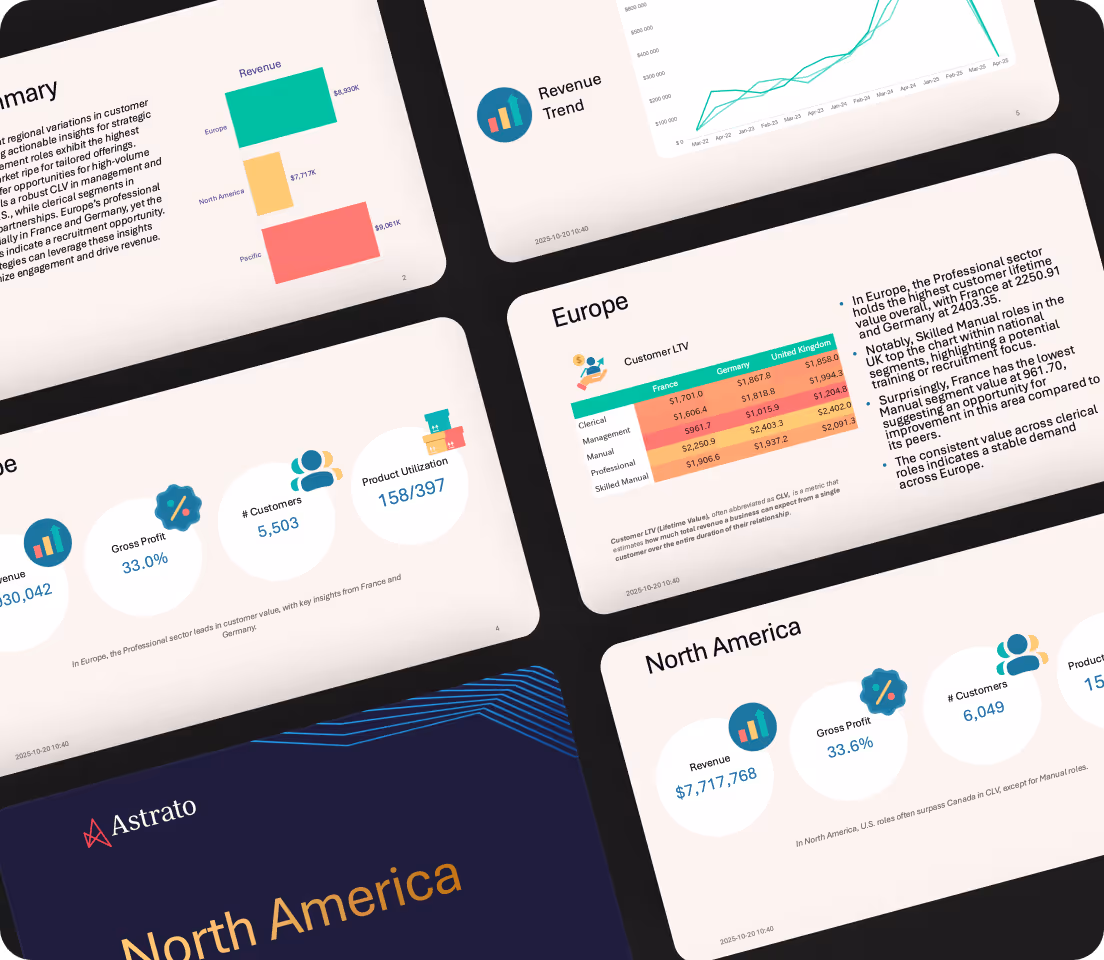
Every client wants a different cut, a different format, a different cadence. Astrato lets you upload your own branded template (or design one), then schedule personalized reports for hundreds of clients – filtered to their data, delivered on their schedule. Your team focuses on insight, not assembly.
Time-stamped reports, generated on schedule, encrypted and archived automatically in S3, Google Drive or SharePoint. When the audit comes, the paper trail is already there without manual preparation.


This is the best tool I've used. The scheduled reporting and alerting features are fantastic. Pixel-perfect visualizations that consistently impress our executive team.

Design once.
Deliver everywhere.
At scale.
Your templates. Your data. No rework.
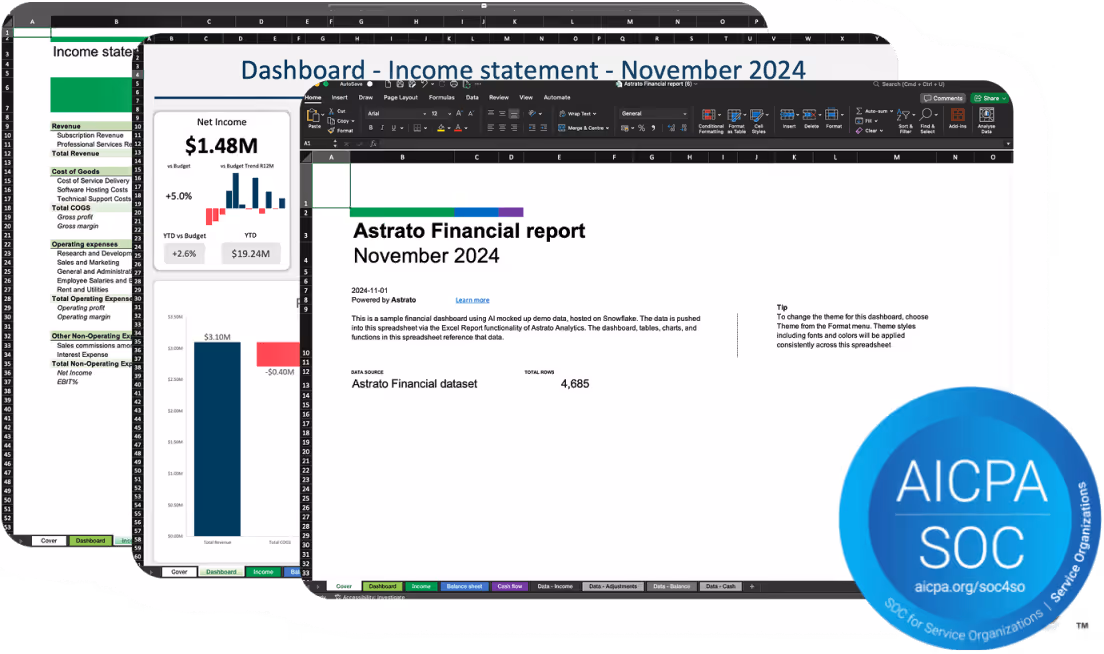
Reuse your existing formatted Excel, PDF or PowerPoint template without rebuilding. Astrato populates it with live warehouse data at report run-time. What you've designed is what gets delivered – formatted, branded, and current.
Hundreds of personalized reports in one single setup
Each recipient gets a version filtered to their data – by role, region, client, or portfolio – with row-level security applied automatically. Set it up once and it runs itself.

Reports delivered where your stakeholders already work
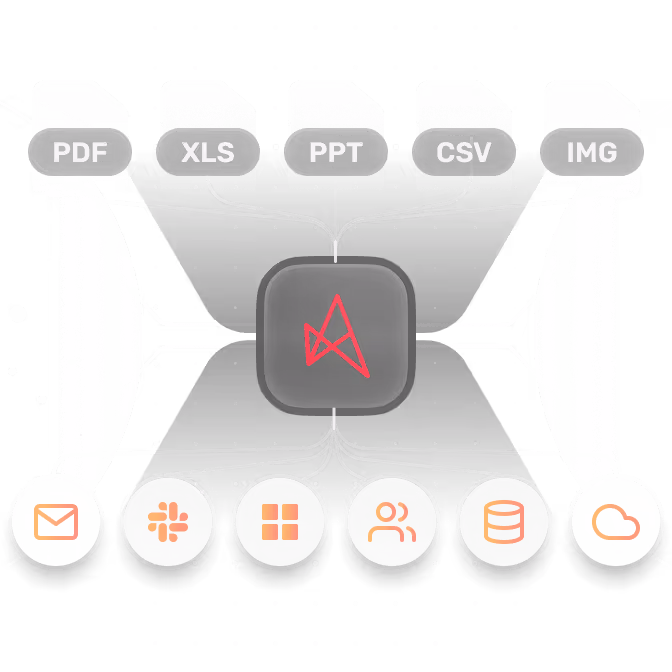
Deliver multiple formats to any destination your organisation uses. On a scheduled cadence or on demand.
Reports with built-in insights and summaries
Astrato's AI automatically generates written narratives alongside your data – summarising trends, flagging anomalies, adding the context your stakeholders would otherwise ask you for. Summaries regenerate with every scheduled run, always reflecting the latest numbers.

End-users can independently generate reports and custom insights without relying on internal support teams, significantly improving productivity for us and our customers.
See your reports run themselves

Frequently asked questions
Can recipients get reports in Slack or Teams instead of email?
Yes. Scheduled reports can deliver to email, Slack channels, Teams, S3, Google Drive or SharePoint alongside the usual PDF/Excel/PowerPoint formats. For internal teams who live in Slack, this often gets way more engagement than an email attachment that disappears in someone's inbox.
Can we send reports to people who never log in to the BI tool?
That's exactly what scheduled reporting is for. Set up a distribution list, pick a schedule, and reports land in recipients' inboxes in whatever format they prefer. Ideal for executives, clients, or long-tail users who want the numbers but won't open a dashboard.
Do scheduled reports respect row-level security?
Yes. Reports are tied to the recipient's identity, so each person gets a version filtered to what they're allowed to see. One report template can deliver hundreds of personalized versions — no need to rebuild per user, region, or customer.
Can finance teams get properly formatted Excel reports with working formulas?
Yes, and it's one of the features finance teams actually ask about in demos. Exports preserve formulas, cell formatting, and layout — not just pasted values. You can hand the file to a controller who can keep working in Excel without rebuilding anything.
Can we burst a single report out to hundreds of customers with their own data?
Yes. One report definition plus parameter-driven filtering means you can deliver personalized, branded PDFs or Excel files to every customer on your list. Common use cases: monthly customer performance reports, partner scorecards, and client-specific board decks.
Why not Sigma Computing embeds?
Modern BI tools improve usability, but still treat embedding as an extension of dashboards.
That means:
- limited control over presentation
- spreadsheet-style UX that doesn’t match most products
- less flexibility in building tailored customer experiences
Astrato lets you design analytics that feel native to your product — not an embedded worksheet.