Top 10 Embedded BI Tools for 2026
Compare the 10 best embedded BI tools for 2026. Side-by-side on white-labeling, multi-tenancy, writeback, semantic layer, AI, pricing, and real user feedback.

Your customers are drowning in data but starving for insight. The irony? Most businesses still force users to leave their workflow, log into a separate analytics platform, and piece together answers using separate tools that were never designed for their context. It’s a broken experience—and your users know it.
Embedded BI tools fix this by integrating embedded analytics directly into the applications your users already live in—whether that’s a SaaS product, a customer portal, or an internal operations tool. Instead of switching tabs, users get interactive dashboards, self-service analytics, and real-time data visualization exactly where decisions are made.
The market agrees: the embedded analytics market is projected to exceed $130 billion by 2029, and organizations that embed analytics capabilities into their products report up to 5× faster decision-making. Data-driven organizations are 23× more likely to acquire customers.
But here’s the catch: not all embedded analytics platforms are created equal. Choose the wrong one and you’re looking at months of wasted development, poor user adoption, ballooning costs, and dashboards nobody uses. Choose the right one and you unlock a genuine competitive advantage.
This article compares the top embedded analytics tools of today. We’re cutting through vendor marketing to evaluate what actually matters. Whether you’re a SaaS founder embedding customer-facing analytics for the first time or a product team replacing a legacy business intelligence tool, this guide will help you find the best embedded analytics platform for your needs.
The Difference Between Internal vs. Customer-Facing Embedding
Before evaluating tools, it's good to understand that "embedded analytics" actually covers two very different use cases, and the one you're building for should shape every decision you make.
Internal embedding integrates analytics directly into the operational tools your employees already use, such as your CRM, ERP, HR platform, or internal portals. The goal is to:
- eliminate context-switching
- accelerate decision-making, and
- make data-driven workflows the default rather than the exception.
For example, when a sales rep can see real-time pipeline forecasts without leaving Salesforce, or a supply chain manager can track inventory health inside their ERP dashboard, that's internal embedding at work. It's about smoother operations and faster decisions.
Customer-facing embedding is something different entirely. Here, analytics become part of your product — a premium, revenue-generating data experience delivered to your customers, partners, or end users. Instead of building analytics for your team, you're building a data product for your market.
The stakes are higher, as the embedded experience needs to look and feel native to your application, handle multi-tenant data isolation, scale to thousands of users, and, no less important, justify a price premium. When done well, customer-facing analytics becomes a competitive moat that drives engagement, reduces churn, and opens entirely new revenue streams.
Why is this important?
The difference is important because the requirements are very different:
- While Internal teams understand that dashboards might load slowly, your customers expect instant responses.
- Internal tools don't need to match your brand's design system, while customer-facing dashboards absolutely do.
- Internal deployment assumes a single tenant, where customer-facing products demand multi-tenant architecture with granular data security.
- While internal embedding is a cost-saving initiative, customer-facing embedding is a revenue initiative.
Most of the tools in this guide support both use cases to varying degrees, but some were originally built for internal BI and later adapted for embedding (Tableau, Power BI, Looker, Qlik), while others were purpose-built for customer-facing analytics from day one (Astrato, Luzmo, Embeddable).
Knowing which group a tool falls into will tell you a lot about how native, performant, and scalable the embedded experience will actually feel.
The Quick Comparison at Glance
Before we dive deep, here’s a side-by-side snapshot of all ten tools. The comparison table covers the key features that matter most when evaluating embedded BI tools.
What Actually Matters When Choosing an Embedded BI Tool
Not all embedded analytics solutions are built the same. Before evaluating individual tools, it’s important to understand the embedded analytics features and criteria that separate a tool you’ll love from one you’ll regret. Here are the ten factors we evaluated each tool against.
1. Embedding depth and method
iframe vs. SDK vs. web components vs. API — the embedding method determines how native the experience feels inside your product. Can you embed individual charts, groups of visuals, or full embedded dashboards? This directly impacts user adoption and the learning curve for your development team.
2. Customization and white-labeling
Can you fully brand the embedded experience with drag-and-drop design tools and CSS control? Full white-labeling is essential for customer-facing analytics that feel native to your product, not bolted on.
3. Data source connectivity
Support for cloud data warehouses (Snowflake, BigQuery, Databricks, Redshift), SQL databases, APIs, and data sources of all types. Strong data connectors reduce data preparation overhead and simplify data management.
4. Semantic layer and data modeling
Does the tool offer semantic modeling or a built-in semantic layer for centralized metrics? Robust data modeling ensures data integrity across all analytics workflows, so teams aren’t reinventing definitions per dashboard. This is a key differentiator for enterprise-grade data management.
5. Self-service for end users
Can non-technical users filter, explore data, and build their own views with self-service analytics—or is the experience read-only? True self-service embedded analytics and self-service BI means ad hoc exploration without IT dependency, which surfaces valuable insights faster for data professionals and business users alike.
6. Multi-tenancy, security, and data governance
Look for tools that meet data governance requirements out of the box. Row-level security, SSO, RBAC, SOC 2, data isolation between tenants, and granular data security. Robust data governance and granular access control with user access control are non-negotiable for SaaS products handling sensitive data access.
7. AI and natural language capabilities
Natural language querying, AI-generated insights, predictive analytics, anomaly detection, and conversational analytics. The best tools let users query data and analyze data in plain natural language.
8. Performance at scale
Load times, caching, and handling large datasets (100M+ rows). The analytics platform should deliver fast data visualization and responsive interactive dashboards even under heavy load. Scalable analytics means performance doesn’t degrade as your user base grows.
9. Writeback
Can users update, annotate, or act on data from within the embedded experience? Most embedded analytics tools are read-only. Writeback transforms dashboards from passive reports into active decision-making tools, a genuine differentiator for teams building data analysis workflows.
10. Pricing and scalability
Usage-based pricing vs. per-user traps vs. flat-rate. Hidden costs for advanced features? Vendor lock-in? The right model supports growth without surprise bills. Also consider deployment options: SaaS, private cloud environments, or Google Cloud environments.
The 10 Best Embedded BI Tools in 2026
Below, we review each tool in detail. Our evaluation draws on product documentation, community feedback from Reddit, Slack, G2, and Capterra, and hands-on research across 15+ ranking articles. We’ve balanced established business intelligence platforms with purpose-built embedded analytics solutions and an open-source option.
1. Astrato: Warehouse-Native BI That Actually Writes Back
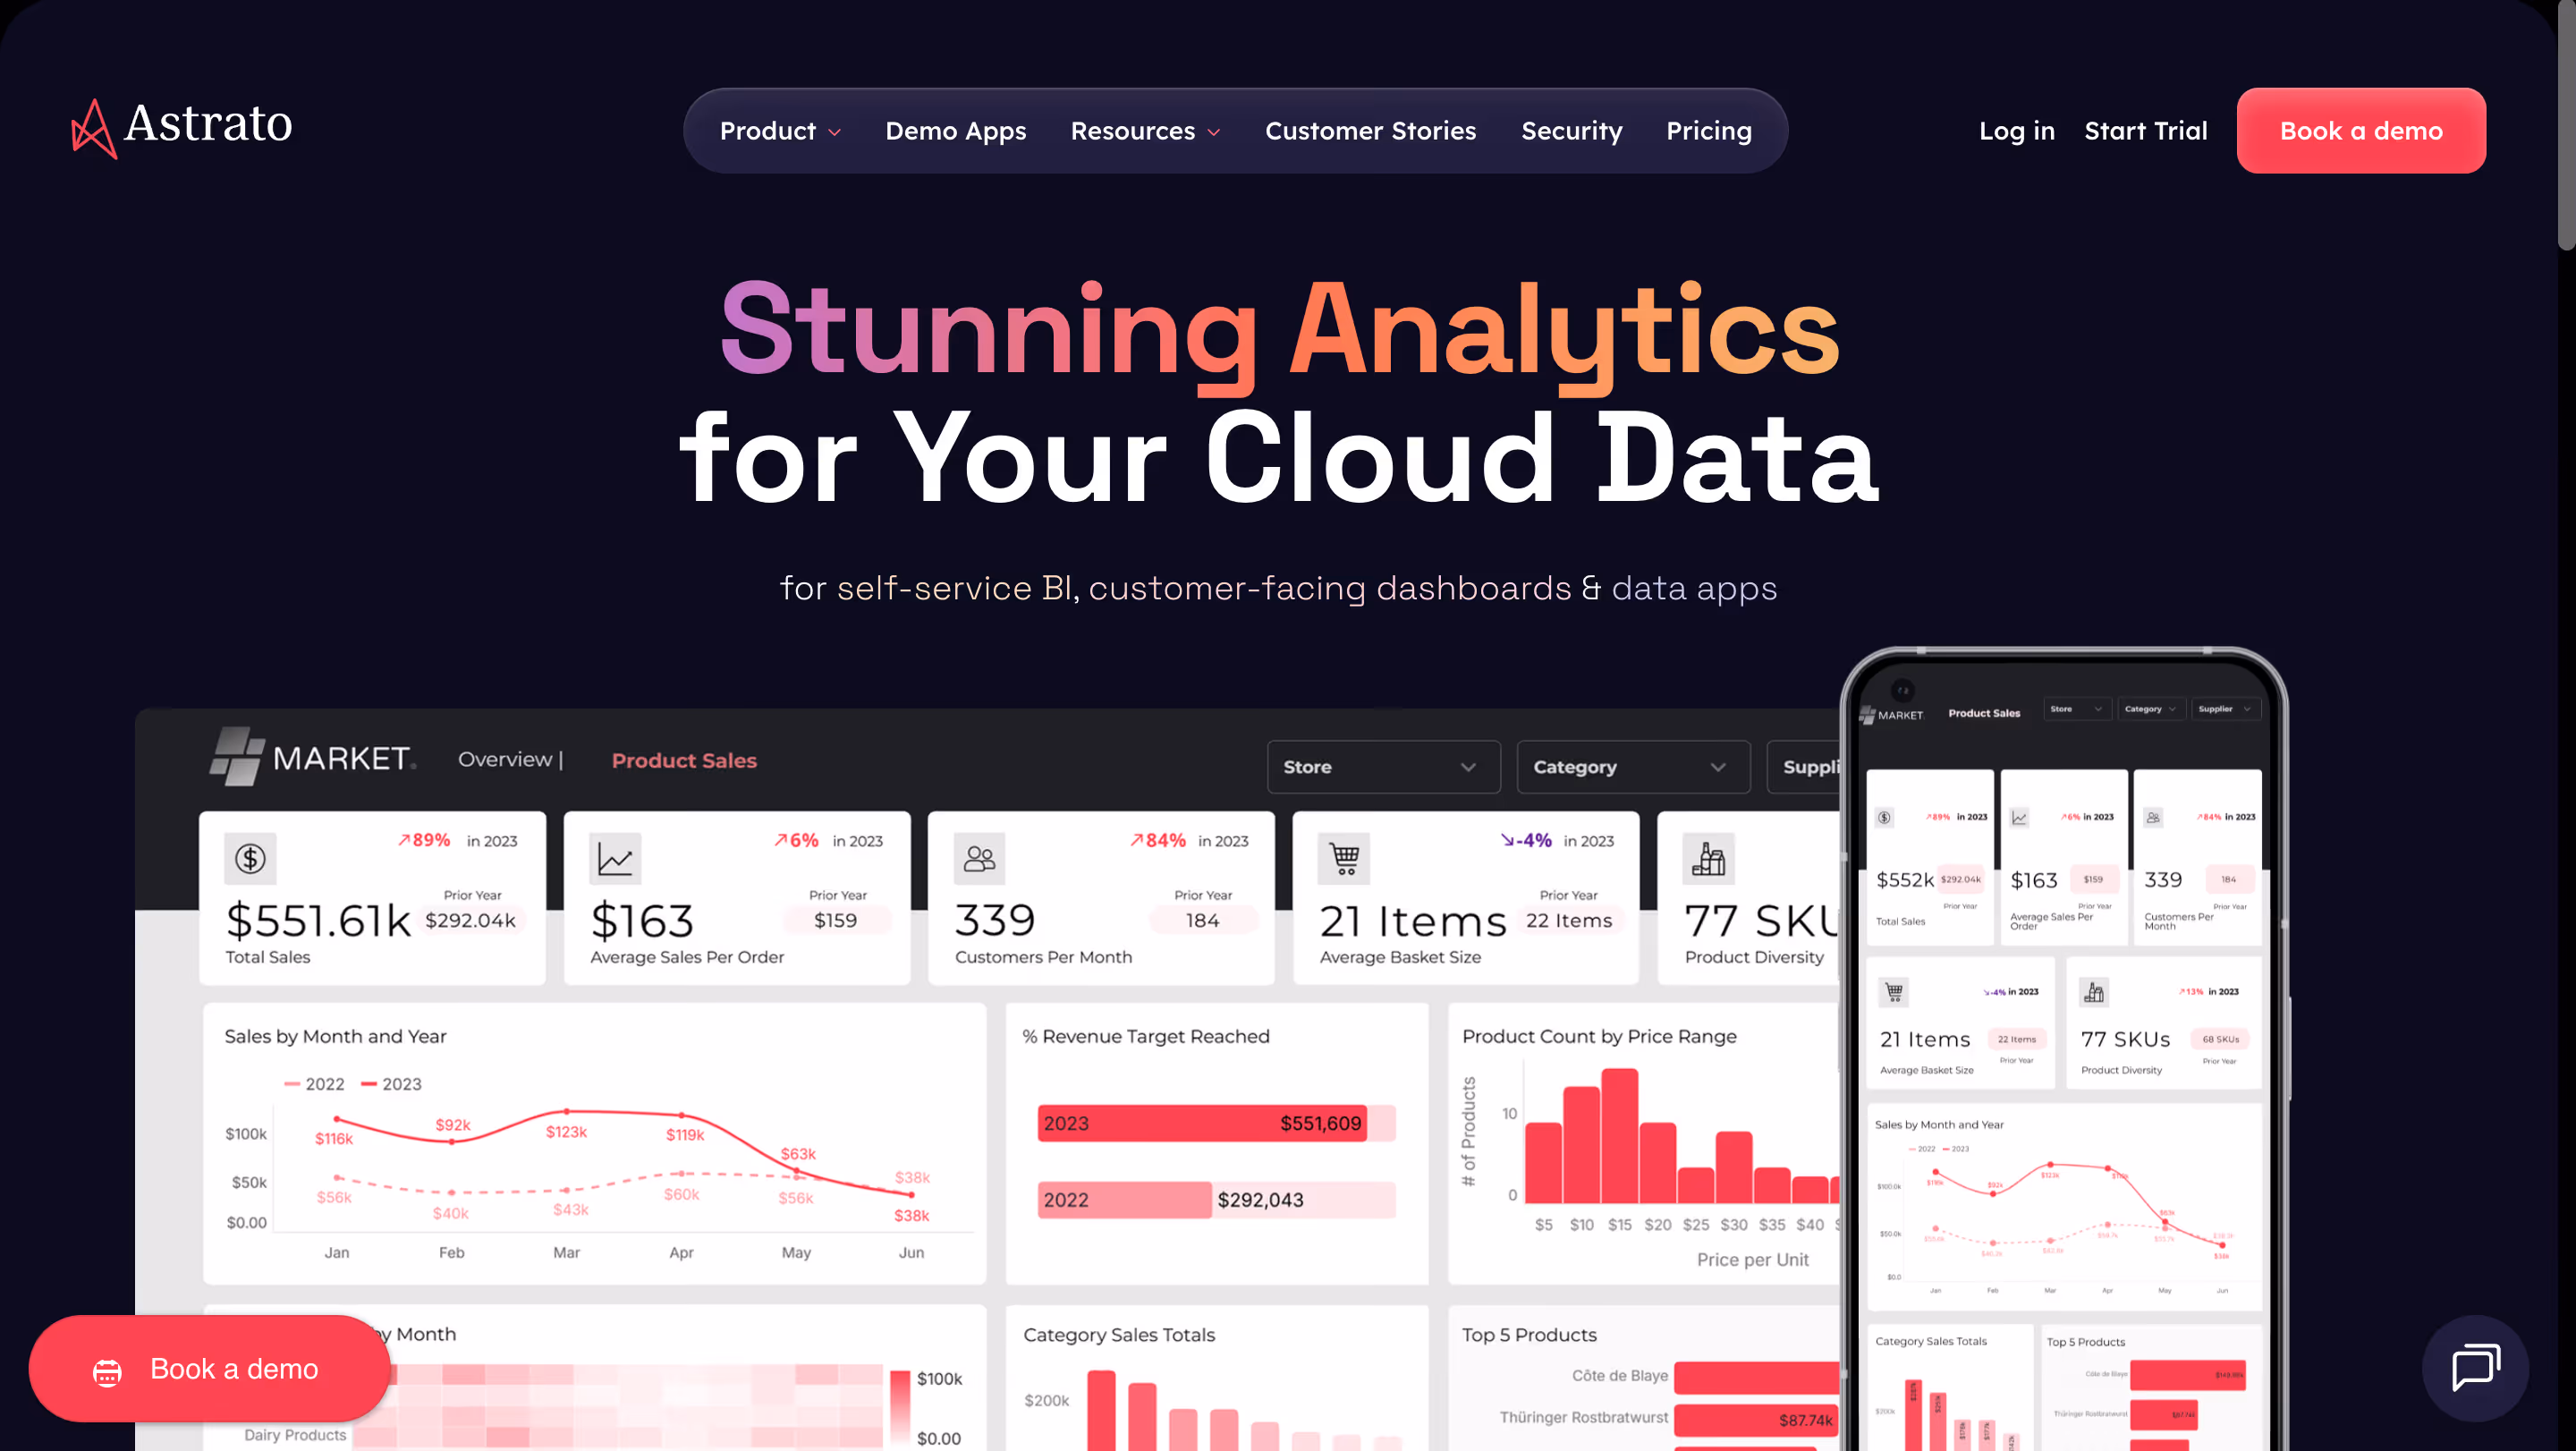
Astrato is a cloud-native embedded analytics platform purpose-built for modern cloud data warehouses like Snowflake, Databricks, and BigQuery. Unlike legacy BI tools that bolt on embedding as an afterthought, Astrato was designed from day one to deliver customer-facing analytics and self-service BI that feel native inside your product.
What makes Astrato stand out in a crowded field is its combination of writeback, a built-in semantic layer, and live-query architecture — features that most competitors simply don’t offer together.
Key Features
- Live-query architecture: Queries hit your data warehouse directly — no extracts, no stale data, no duplication. This ensures data integrity and real-time data visualization at any scale.
- Multi-tenant by design: Keeps each customer’s data, configurations, and user management securely isolated.
- Writeback: Users can update records, approve budgets, adjust forecasts, and trigger workflows directly from within embedded dashboards. Most competitors are read-only.
- Built-in semantic layer: Define metrics once and reuse them across all dashboards. Semantic modeling ensures consistency and supports robust data governance across your entire analytics workflows.
- AI-powered insights: Natural language querying lets users ask questions in plain English. You can also plug in your own AI provider for conversational analytics tailored to your use case.
- Drag-and-drop self-service: No-code measure building, pixel-perfect customizable dashboards, and an intuitive UI that non-technical users can actually navigate. True self-service analytics that drives user adoption.
- Full white-labeling: Embed individual charts, groups of visuals, or complete dashboards, fully branded to match your product’s look and feel.
- Enterprise-grade security: Role-based permissions, SSO, granular data security, and data isolation for multi-tenant deployments.
Customers consistently praise Astrato’s speed (dashboards load almost instantly), cost savings over legacy tools like Qlik and Tableau (50–75% savings reported), and the writeback capability that turns dashboards into actionable tools.
Pricing
Astrato has transparent usage-based pricing that scales with your business, no vendor lock-in. A stark contrast to the opaque enterprise quotes common in this space.
Who Is Astrato Best For?
SaaS companies and data teams on Snowflake, Databricks, or BigQuery who want cloud analytics with writeback, a semantic layer, and scalable analytics, without the price tag or complexity of legacy BI. This is the best embedded analytics solution for teams that need their embedded experience to do more than just display charts.
Watch Out For
As a newer entrant, Astrato has a smaller community than established players like Tableau or Power BI. However, the product is maturing rapidly, and their customer stories demonstrate serious enterprise traction.
2. Power BI Embedded: The Microsoft Ecosystem Powerhouse
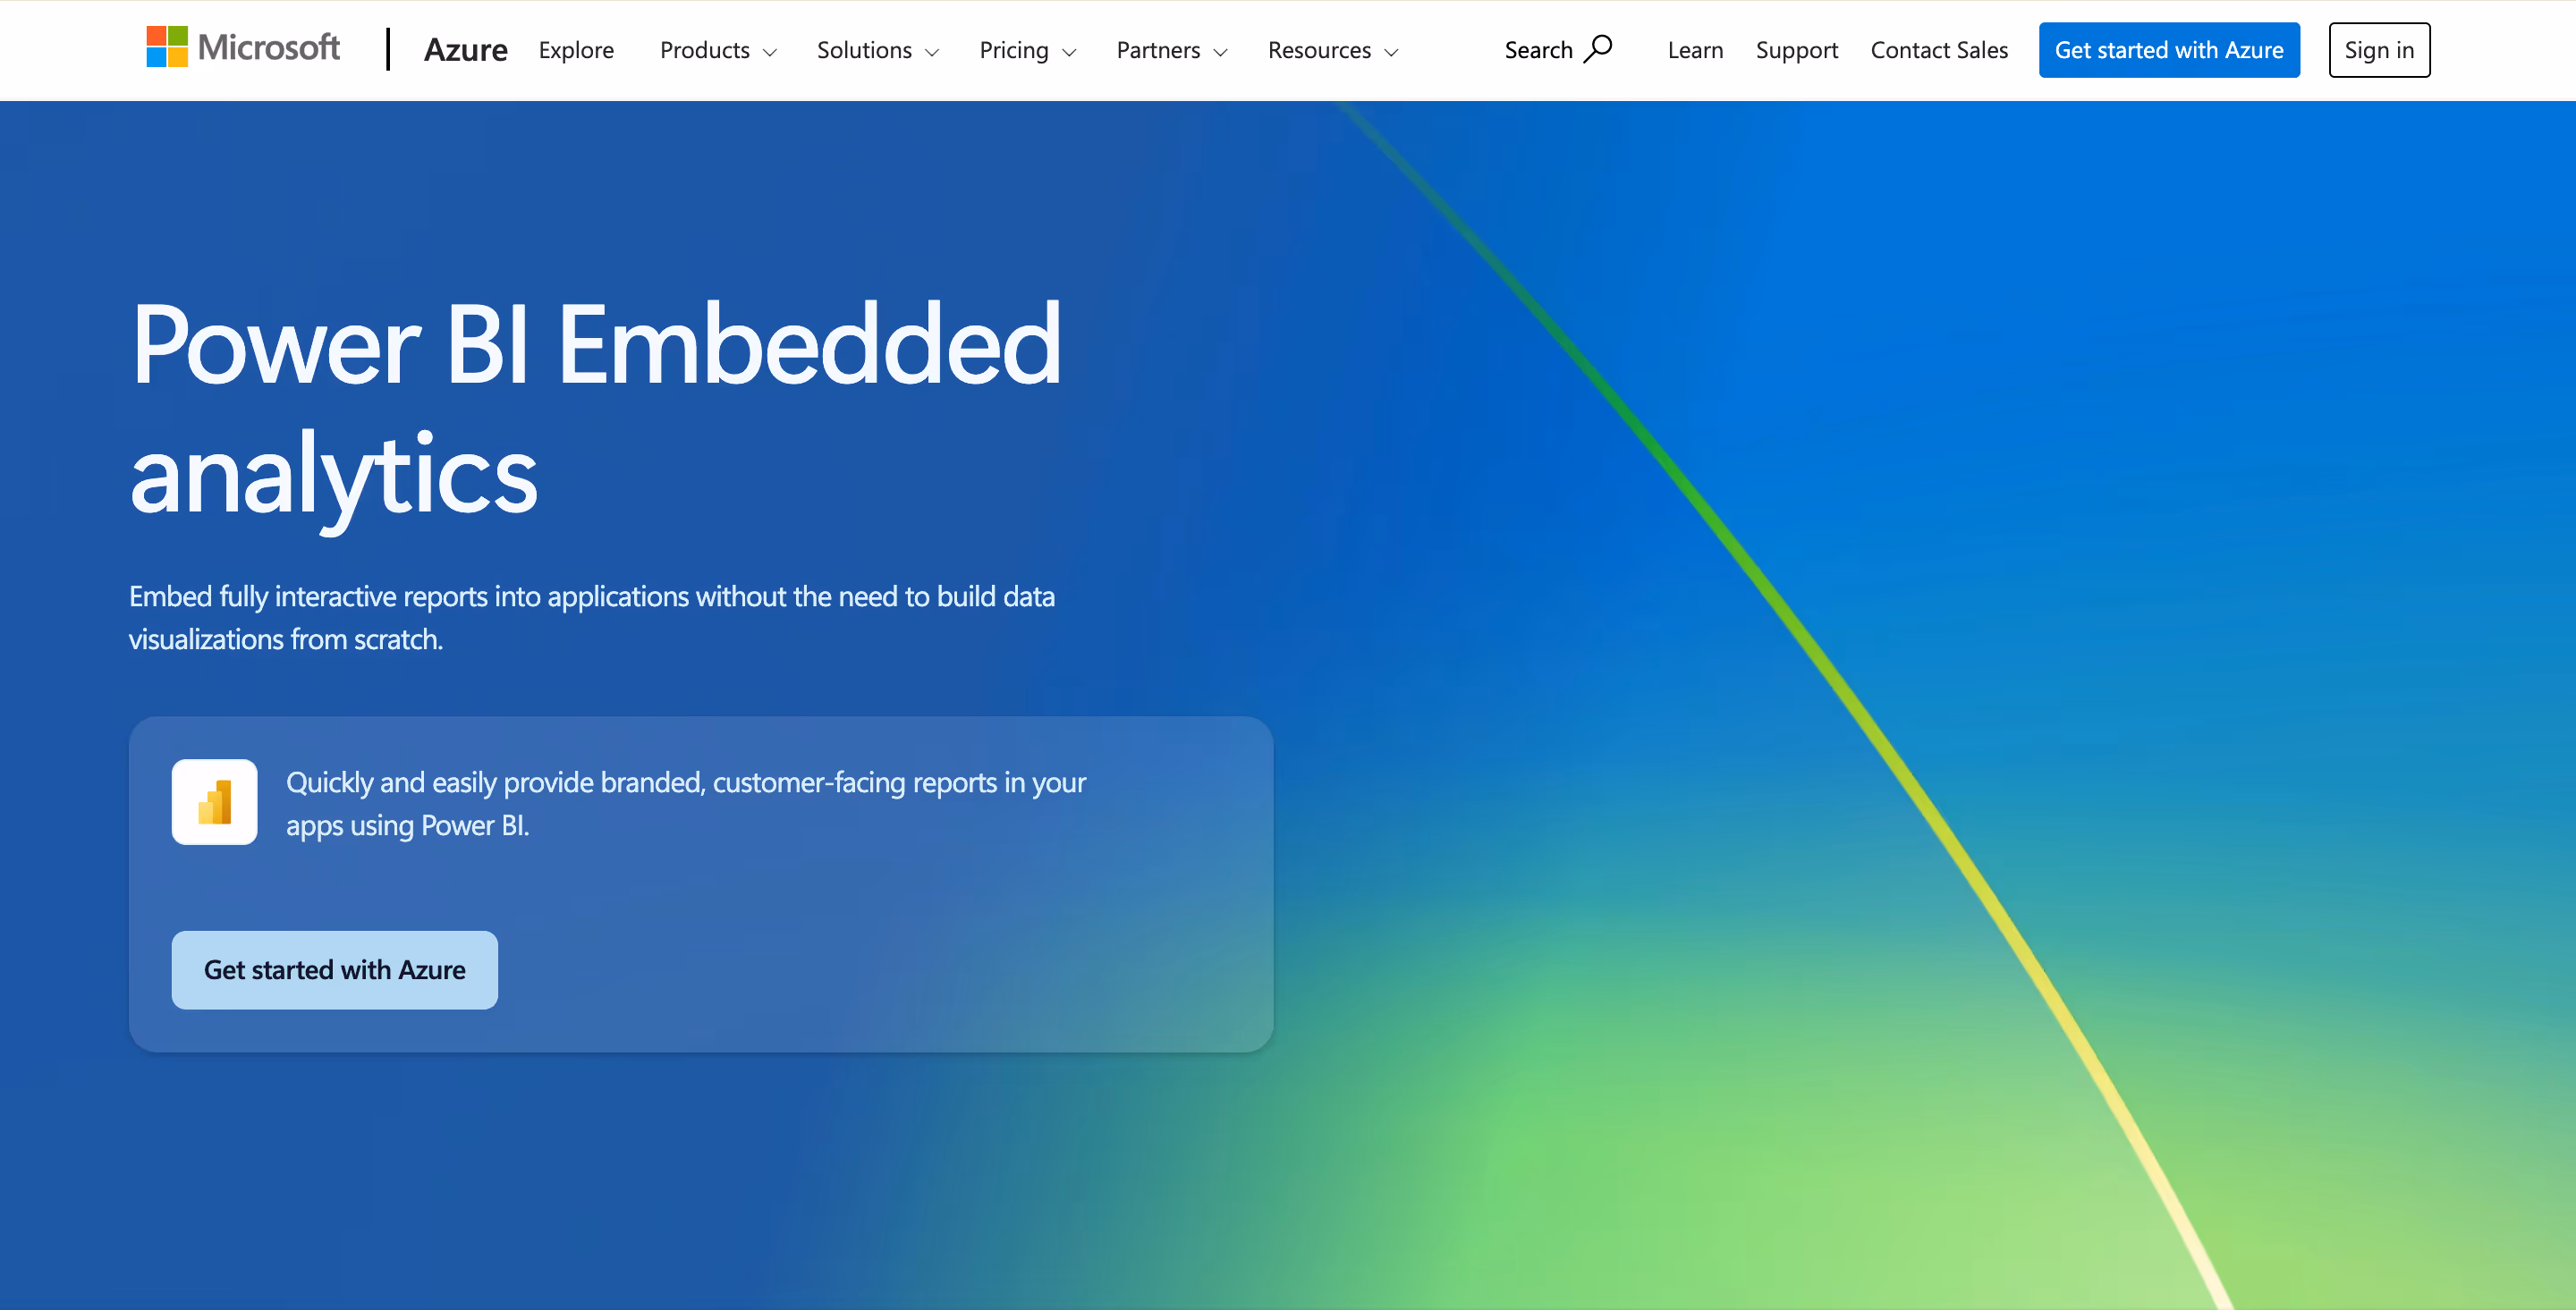
Power BI Embedded is Microsoft’s offering for integrating Power BI reports and dashboards into custom applications. It combines the full power of the Microsoft ecosystem: Azure, Office 365, and Copilot AI, which makes it a natural fit for organizations already invested in Microsoft infrastructure. As a mature business intelligence platform, it offers deep data analysis capabilities and extensive data connectors.
Key Features
- Robust data modeling: The Tabular semantic model provides a powerful data modeling layer with DAX formulas and relationships for advanced analytics.
- Copilot AI: Generative AI assistant for building visuals from prompts, Q&A for natural language queries, and AI visuals including Key Influencers and Decomposition Trees. Also supports predictive analytics via Azure ML integration.
- Extensive integration capabilities: Hundreds of native connectors to SaaS tools, databases, and Azure services. Deep Microsoft 365 integration with Excel, Teams, and SharePoint.
- Embed for customers or organization: Two embedding models—“App Owns Data” (no Power BI login needed) and “User Owns Data” (requires Power BI login).
- Data management: Dataflows, datasets, and incremental refresh for managing large-scale data preparation and transformation pipelines.
Users praise the deep Microsoft integration and the sheer breadth of the platform. However, community feedback consistently flags the complex licensing model,especially for external (customer-facing) embedding, as a major pain point.
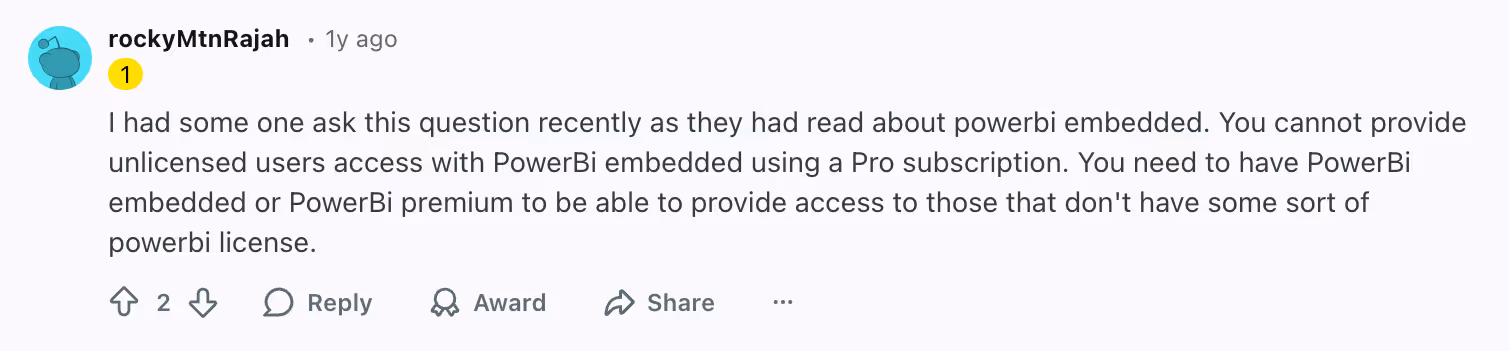
The capacity-based pricing (Azure SKUs) can be difficult to forecast, and the embedded experience often retains a distinctly “Microsoft” look and feel.
Pricing
Capacity-based via Azure SKUs, starting around $5/hour for an A1 node. Pro licenses ($9.99/user/month) and Premium Per User ($20/user/month) are also available but have different embedding limitations. Enterprise deployments are typically bundled into broader Azure deals, making true cost comparison challenging.
Who Is Embedded Best For?
Organizations deeply invested in the Microsoft ecosystem that need powerful analytics software with extensive data connectors and don’t mind managing Azure capacity for embedded workloads.
Watch Out For
Licensing complexity is real, especially for customer-facing embedding. White-labeling is partial at best, and the UI tends to feel like Power BI rather than your own product. Writeback is not natively supported in the embedded experience.
3. Tableau: The Visualization Icon, Now Embedded
Tableau Embedded Analytics brings the industry’s most recognized data visualization platform into embedded scenarios. Acquired by Salesforce, Tableau offers stunning visual storytelling and access to a vast library of data sources and community-built connectors. It remains the go-to for data professionals who prioritize visual richness above all else.
Key Features
- World-class data visualization: Nearly limitless chart types, custom visuals, and interactive dashboards with drill-down capabilities. 98% of users praise its visual flexibility.
- Einstein Copilot and Ask Data: Salesforce’s AI layer enables natural language queries and AI-generated visual suggestions.
- Broad data connectivity: Connects to virtually any data source.
- Embedding via JS API: Embed interactive dashboards on web portals, in Salesforce, Shopify, SharePoint, and mobile apps.
Tableau’s visualization capabilities are nearly universally praised. However, community feedback reveals significant advanced features gaps for embedded use cases: iframe-based embedding feels bolted on rather than native, and performance degrades at scale. The learning curve is steep, as about 25% of users mention this as a significant barrier.
Pricing
Per-user tiered: Creator ($75/user/mo), Explorer ($42/user/mo), Viewer ($15/user/mo). Costs escalate quickly at scale. Hosting charges are separate. There are no consumption-based options for embedded deployments.
Who Is Tableau Best For?
Teams that prioritize visual storytelling and are already in the Salesforce ecosystem. Best suited for internal analytics features with some embedding, rather than deeply embedded customer-facing products.
Watch Out For
Limited white-labeling, as Tableau’s UI is always visible. No native writeback. Expensive at scale. Embedding requires Tableau Server or Cloud, adding hosting complexity. Not purpose-built for embedded use.
4. Looker: Google’s Governed Data Modeling Machine
Now part of Google Cloud, Looker is built around LookML, a proprietary modeling language that enables robust data modeling and semantic modeling at scale. Since it uses the same semantic modeling layer as the core product, embedded reports keep consistent, governed data definitions across all platforms. This makes it a strong choice for data engineering teams that value data governance requirements and centralized data access control.
Key Features
- LookML semantic layer: Define data relationships, metrics, and business logic in code. Ensures consistent analytics workflows across the organization.
- Real-time data exploration: Users work with live data rather than cached extracts.
- Google Cloud integration: Native integration with BigQuery and the broader Google ecosystem, ideal for Google Cloud environments.
- Gemini AI: Google’s AI assistant for conversational data queries.
- API-first architecture: Extensive APIs for programmatic access, though iframe-based embedding with no SDK.
Users praise LookML’s power for data modeling and governance. However, the learning curve is consistently cited as a significant barrier, since LookML requires dedicated training, and non-technical users find the platform challenging. Embedding is functional but not its primary strength; the experience often feels like Looker rather than your own product.
Pricing
Custom quotes only. Looker is widely considered one of the more expensive options in the space, particularly for embedding use cases.
Who Is Looker Best For?
Data engineering teams on Google Cloud who prioritize governance, metric consistency, and centralized data modeling over ease of embedding or white-labeling.
Watch Out For
No SDK, embedding is iframe and API-based. Partial white-labeling only. Steep learning curve requires dedicated LookML developers. Expensive for embedded-only use cases.
5. Sisense: The Developer’s Embedded Analytics Playground

Sisense positions itself as an Analytics-Platform-as-a-Service (AnPaaS), focusing on developer-friendly embedded analytics solutions with its Compose SDK. It handles complex data models well and offers strong advanced analytics including AI-driven insights, anomaly detection, and prescriptive analytics.
Key Features
- Compose SDK: A developer toolkit for building fully customized, interactive dashboards with minimal code. Stronger analytics capabilities than basic iframe embedding.
- AI-powered features: Natural language queries, predictive analytics, anomaly detection, and embedded insights that surface patterns automatically. Strong embedded analytics features.
- Complex data handling: ElastiCube in-chip technology for processing large, complex datasets. Supports data isolation for multi-tenant environments.
- Full white-labeling: Complete customization of the embedded experience, though CSS and JavaScript skills are required for deeper customization.
Users appreciate the flexibility of the Compose SDK and the platform’s ability to handle complex data. However, implementation can be challenging for non-technical users, and this analytics software has a steeper onboarding curve than some alternatives. Some users report slow loading times with very large datasets and note that pricing is opaque.

Pricing
Custom quotes only. Generally positioned as an enterprise solution with pricing to match.
Who Is Sisense Best For?
Development teams building data products who need deep SDK-level control over the embedded experience and can invest in implementation.
Watch Out For
Requires technical expertise for implementation and customization. Pricing is opaque. No writeback. Can be overkill for teams that need straightforward embedded dashboards.
6. Qlik Sense: Associative Analytics for the Enterprise
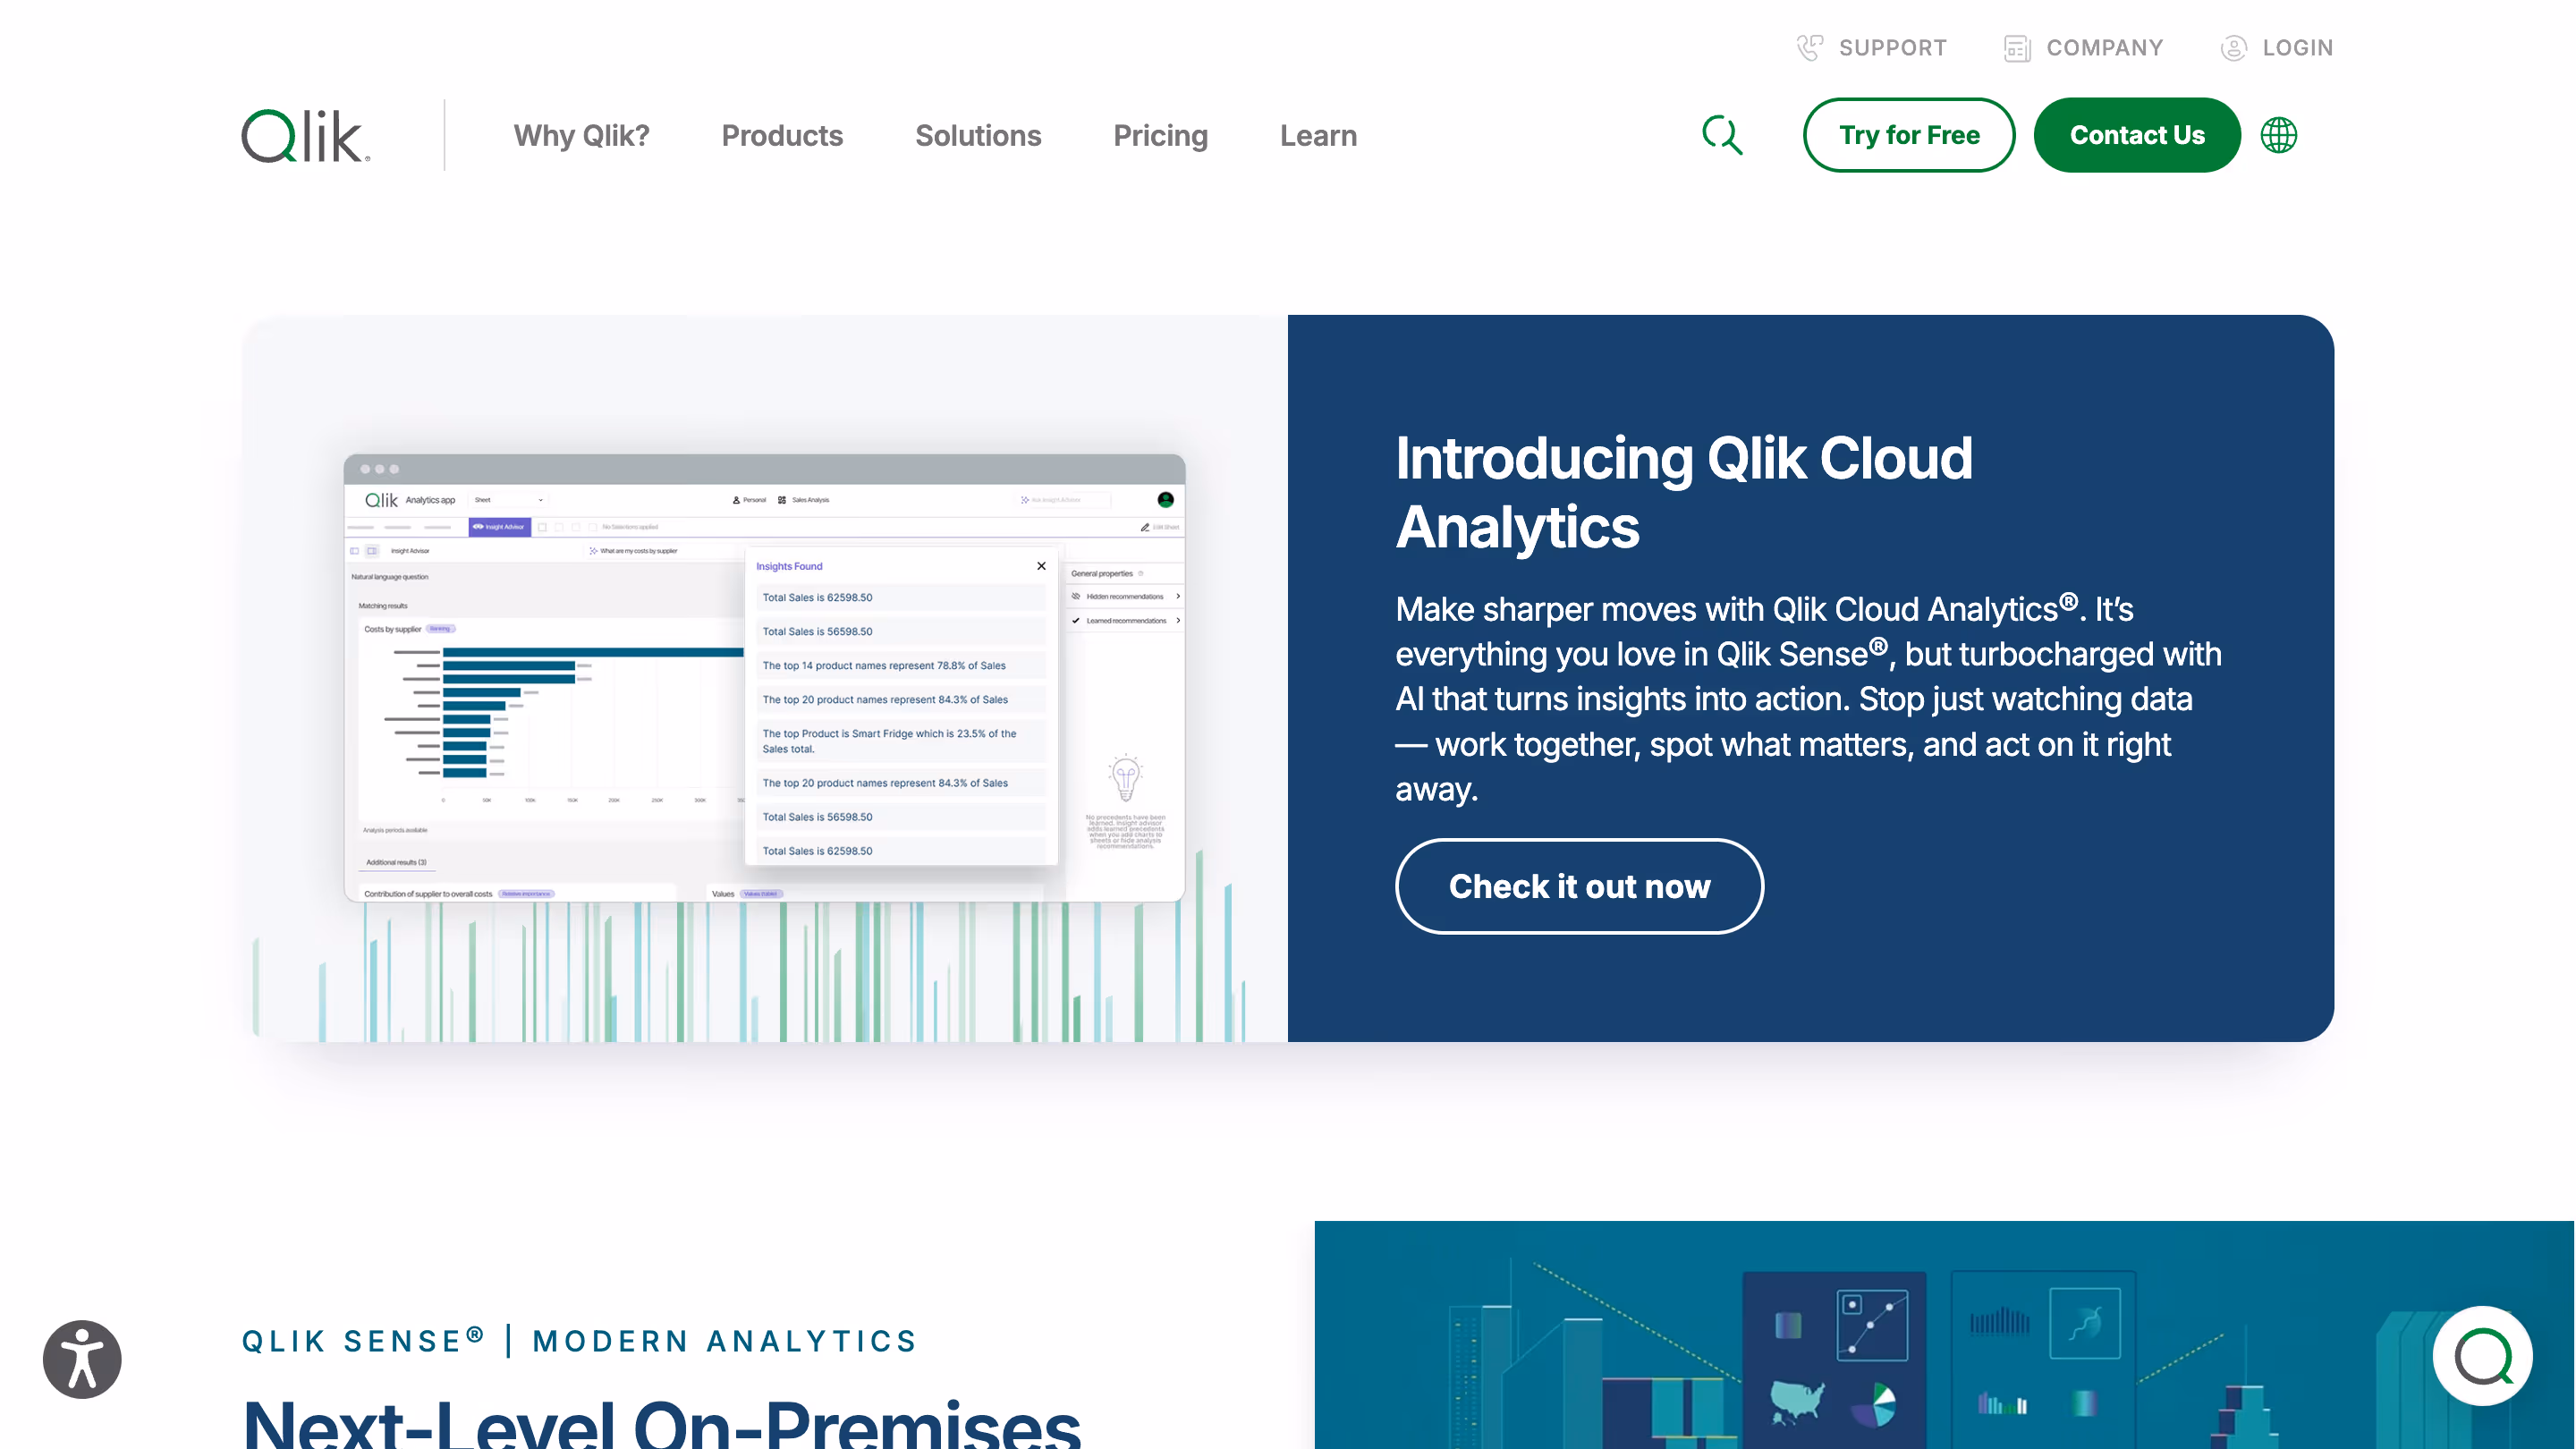
Qlik Sense is built around its unique associative data model, which lets users explore data relationships dynamically rather than following pre-built query paths. This makes it a good choice for data analysis and ad hoc exploration, especially in complex enterprise environments. It’s a heavyweight among business intelligence platforms with strong governance and AI features.
Key Features
- Associative engine: Reveals relationships across data that traditional SQL-based tools miss. Powerful for unrestricted data analysis and discovery.
- Insight Advisor and Qlik Answers: AI-powered assistant for auto-generated visualizations and natural language data exploration. Strong analytics capabilities.
- Open APIs: Extensive customization via APIs and JavaScript mashups for tailored embedding experiences.
- Data management: Built-in ETL, data management, and data integration capabilities for end-to-end workflows.
The associative engine is consistently praised as a genuine differentiator for exploratory analysis. However, about 87% of users who mention pricing find the tool expensive, and 86% of users citing performance note lag when processing large, complex datasets. The embedding setup is complex, often requiring JavaScript mashups and significant developer effort.
Pricing
Per-user (starting around $30/user/month) or capacity-based. Enterprise pricing requires custom quotes.
Who Is Qlik Sense Best For?
Large enterprises that need associative exploration and strong governance, particularly those already invested in the Qlik ecosystem.
Watch Out For
Complex embedding setup. Partial white-labeling. Expensive. Performance can lag with large datasets. Not purpose-built for embedded use.
7. Sigma Computing: The Spreadsheet That Queries Your Warehouse
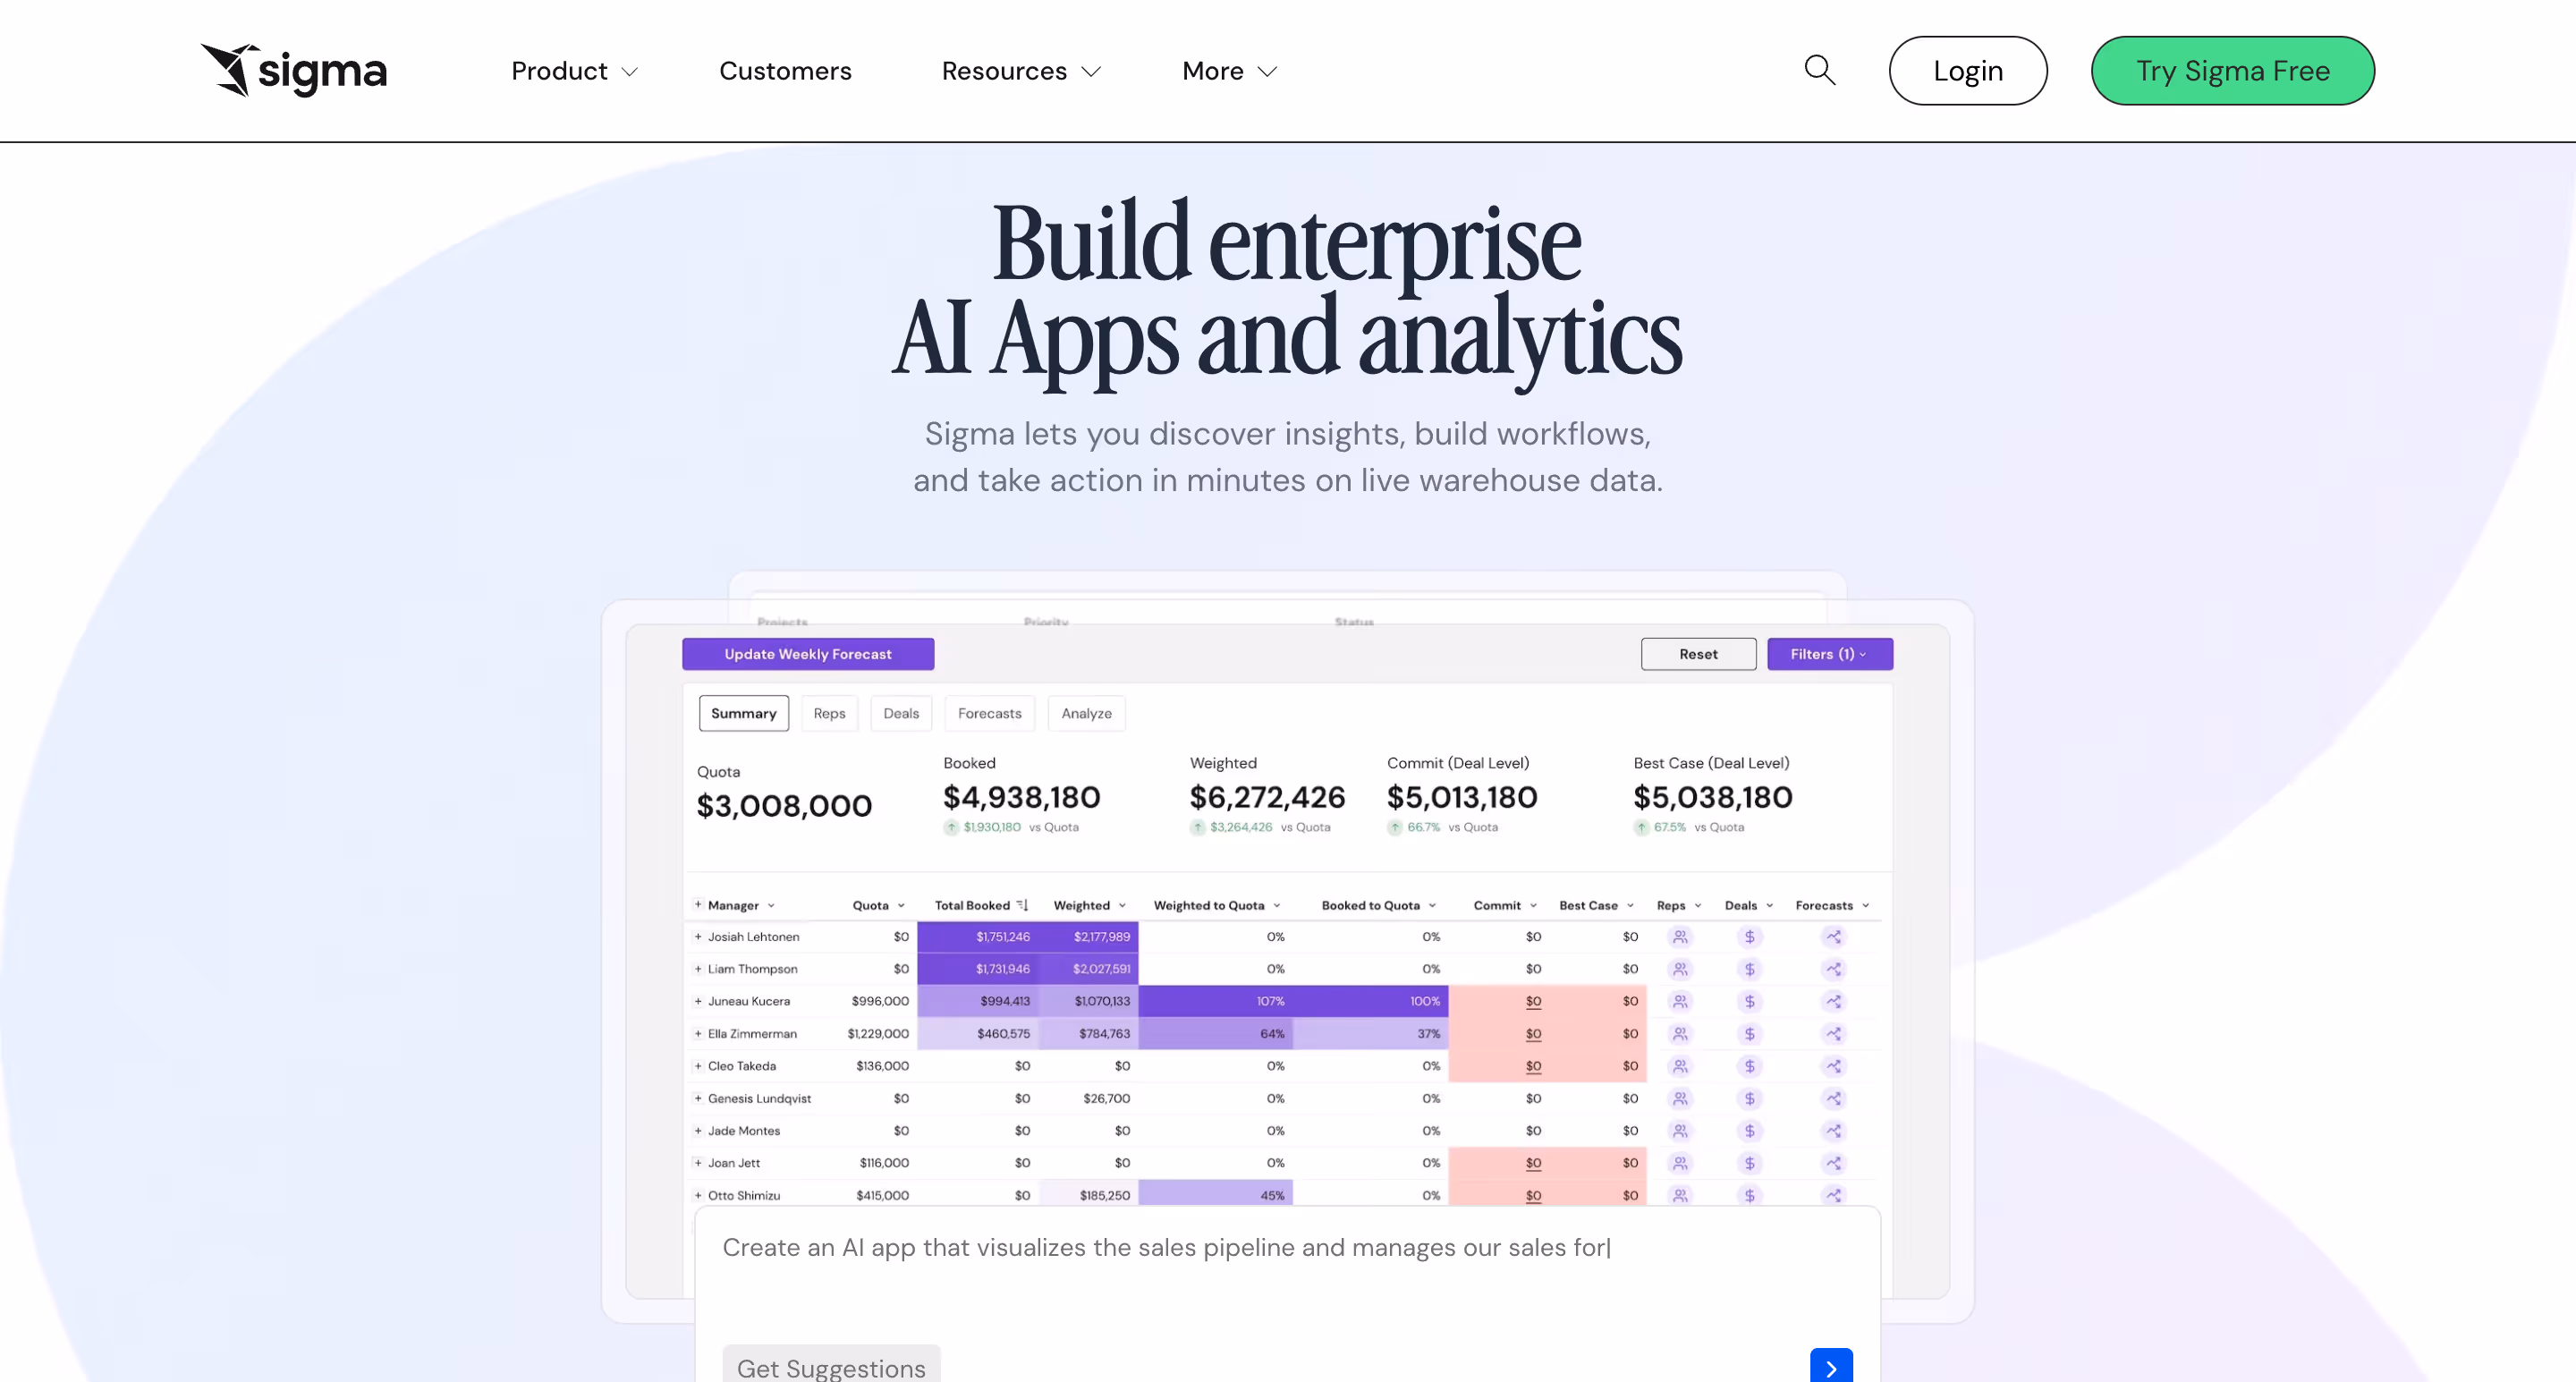
Sigma Computing bridges the gap between spreadsheets and cloud data warehouses with a familiar, spreadsheet-style interface that queries live warehouse data. It’s designed for non-technical users who are comfortable with Excel but need direct access to warehouse-scale data. Sigma offers self-service embedded analytics with a uniquely approachable UX.
Key Features
- Spreadsheet-style interface: Users explore data and analyze data using familiar spreadsheet concepts — no SQL required.
- Live warehouse queries: Connects directly to Snowflake, BigQuery, Databricks, and other cloud warehouses for real-time analysis.
- Input tables: A limited form of writeback that allows users to add data directly within workbooks.
- AI assistant: Helps users build formulas and explore data using natural language.
- Embedding via iframe: Dashboards can be embedded into applications for customer-facing use.
Users appreciate the familiar interface and live warehouse connectivity. However, the platform is better known for internal analytics than embedded use cases. Some community members note that visualizations lack depth, and the actual embedding experience (iframe-based) is less customizable than purpose-built embedded tools.
Pricing
Per-user pricing. Custom quotes required for most plans.
Who is Sigma Best For?
Finance and accounting teams who want a spreadsheet-like experience connected to their cloud warehouse. Better suited for internal self-service analytics with some embedded capabilities than for deeply embedded customer-facing products.
Watch Out For
iframe-only embedding with partial white-labeling. Better for internal than customer-facing use. Input tables are not full writeback. No built-in semantic layer at the platform level.
8. Luzmo: SaaS-Ready Dashboards, Out of the Box
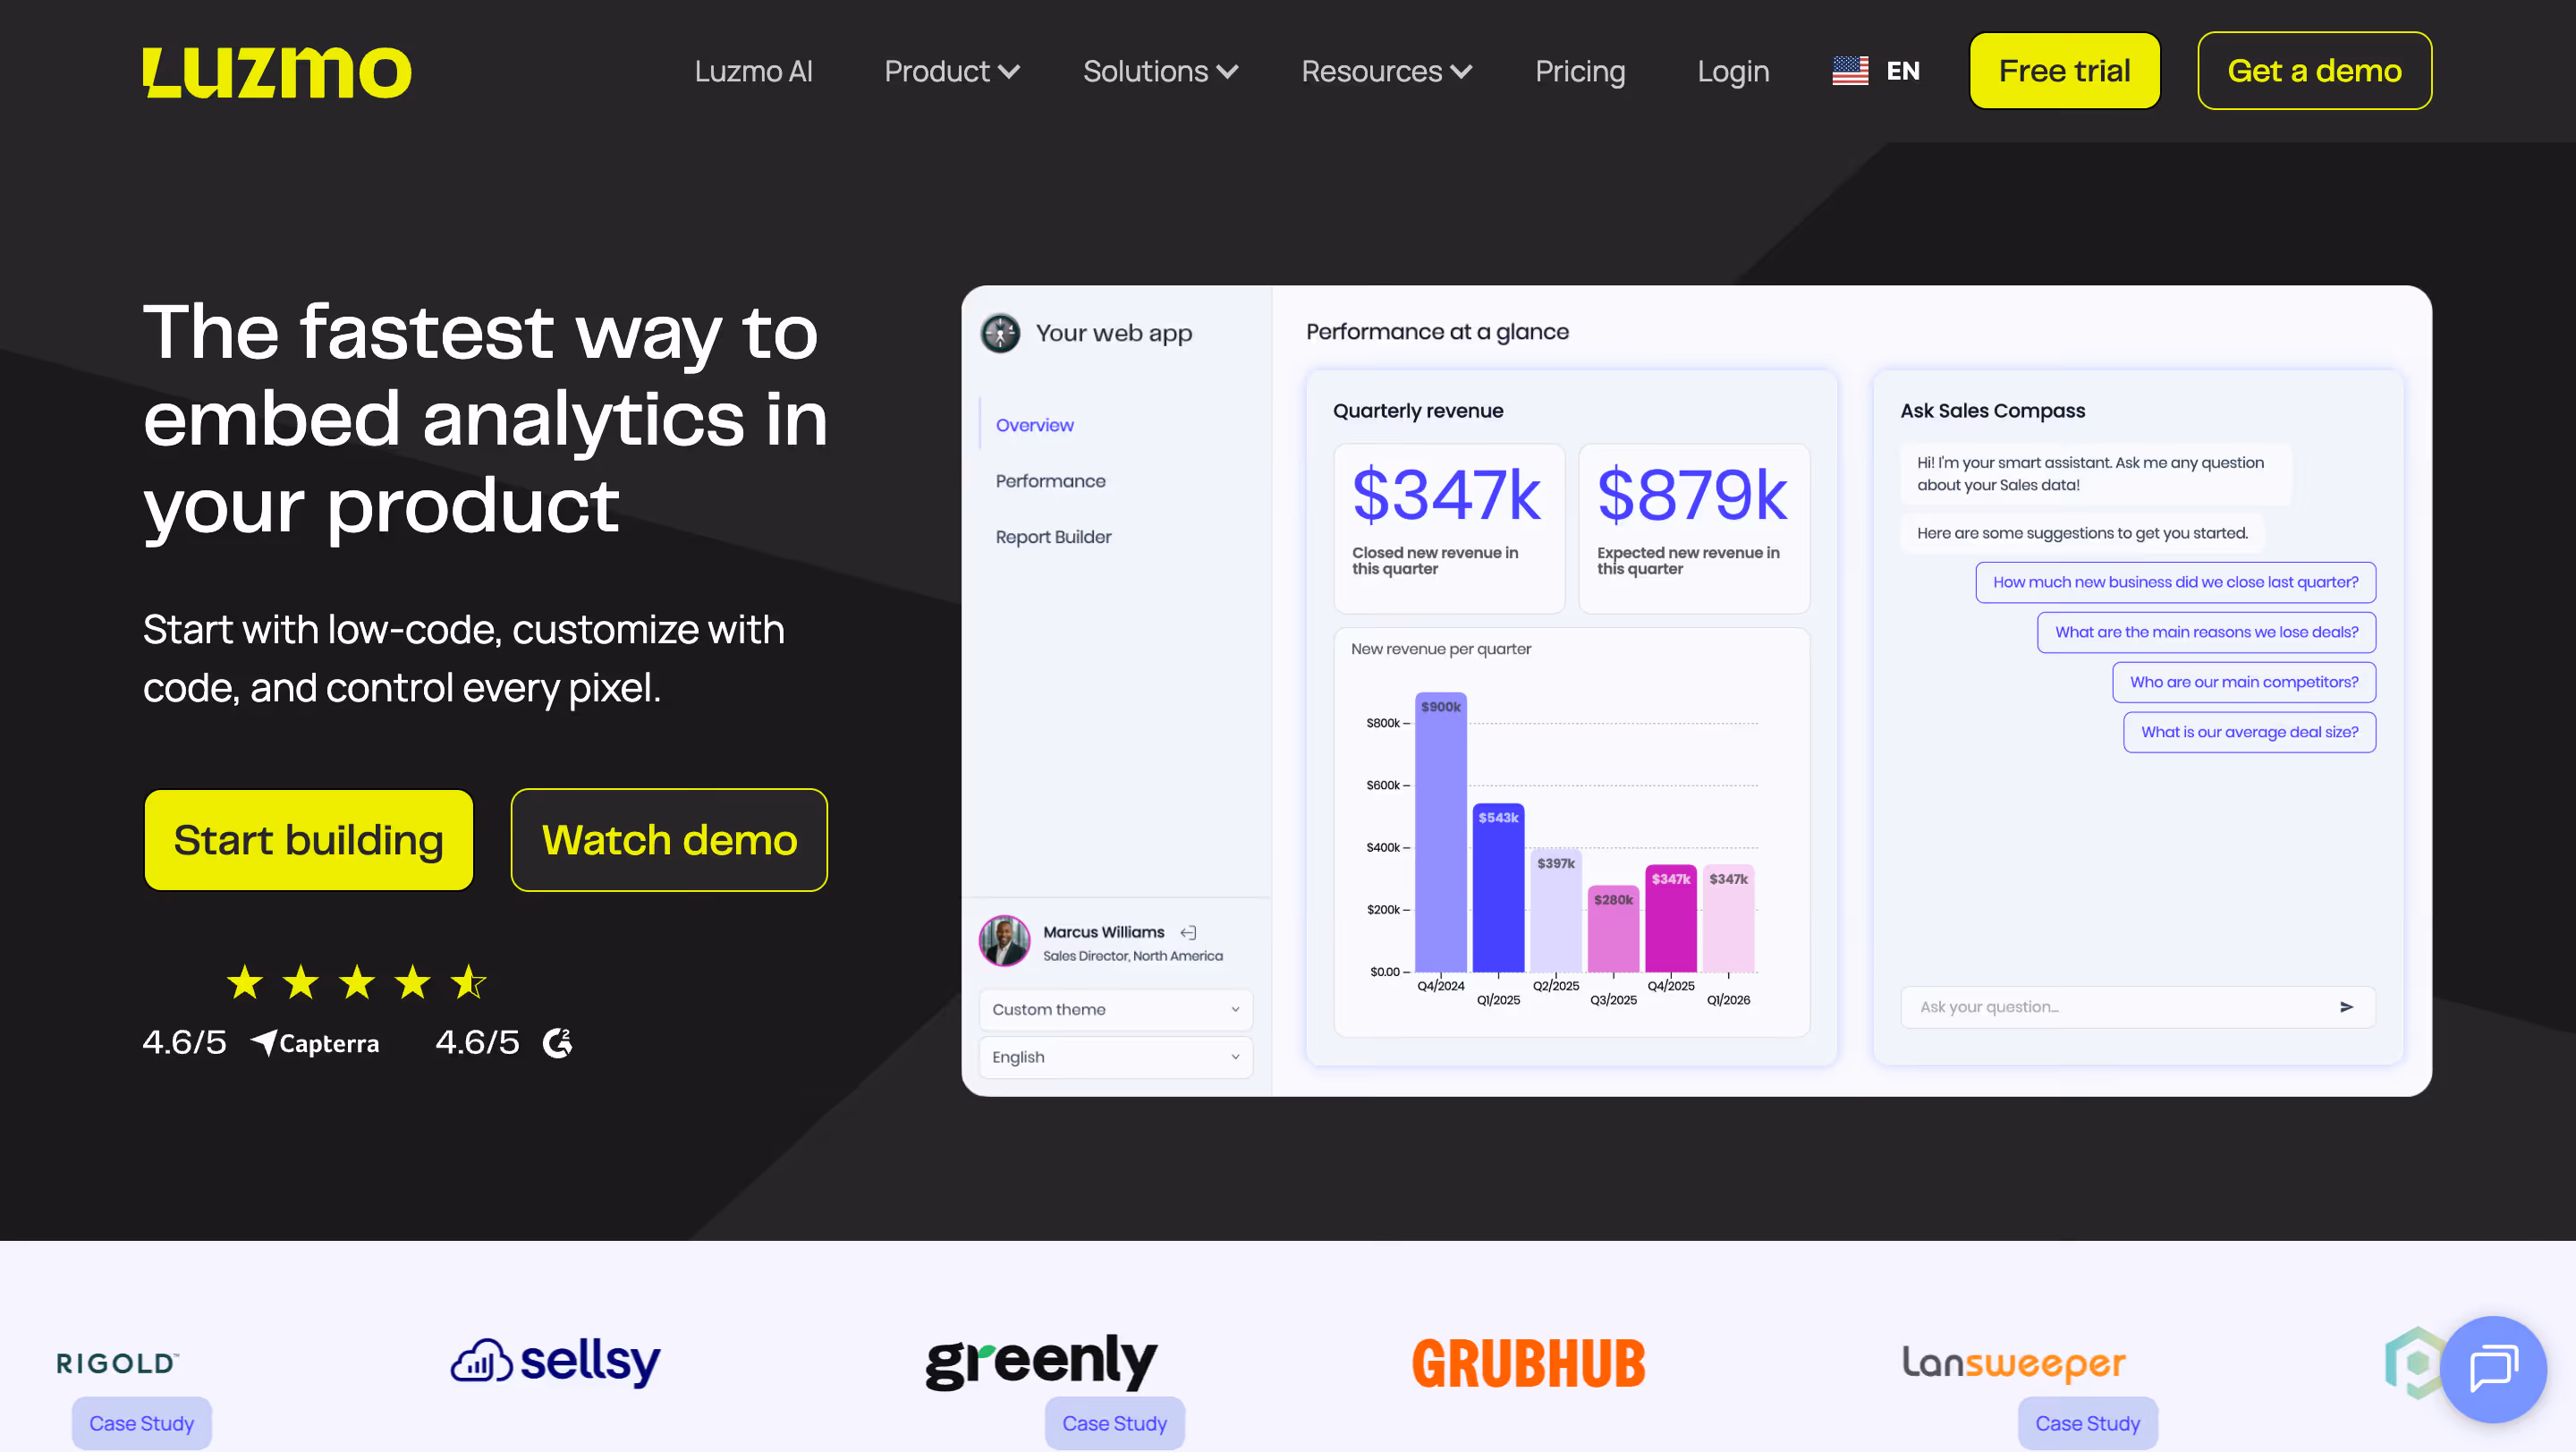
Formerly known as Cumul.io, Luzmo is a lightweight embedded analytics platform purpose-built for SaaS companies that need to ship customer-facing analytics fast. It offers a streamlined path from zero to deployed embedded dashboards with a no-code builder, web components for embedding, and multi-tenancy out of the box.
Key Features
- Fast deployment: Get from zero to production-ready dashboards in days, not months. Drag-and-drop builder for non-technical teams.
- Web component embedding: Embed via lightweight web components or iframe, avoiding some of the limitations of pure iframe approaches.
- Multi-tenancy built in: Excellent tenant-level data isolation with role-based access control.
- White-labeling (paid tier): Full branding control, though removing Luzmo’s own branding requires a higher pricing tier.
- AI chatbot: Conversational interface for trend data exploration.
- Customizable dashboards: Customizable dashboards with theming, though some users report limitations in deep visual customization.
Users consistently praise Luzmo’s ease of setup and the responsiveness of their support team. The multi-tenancy approach is well-regarded. However, reviews flag limitations: missing features like nested formulas and alerts, performance issues with larger datasets, and a chart library that can feel restrictive for advanced use cases. As one Capterra reviewer noted, “Luzmo is a young solution, and there are sometimes inconsistencies.”
Pricing
Usage-based pricing starting at approximately $995/month. Scales with users and designers. White-labeling requires the Pro tier ($2,000+/month). Enterprise caps at 1,000 monthly users and 30 developers, which may be limiting for larger deployments.
Who is Luzmo Best For?
SaaS startups and product teams that need simple, fast-to-deploy embedded dashboards without heavy engineering investment.
Watch Out For
No writeback. Limited advanced analytics. Performance concerns with large datasets. Pricing escalates at scale. Not ideal for complex enterprise requirements.
9. Metabase: Open-Source Embedded Analytics for Lean Teams
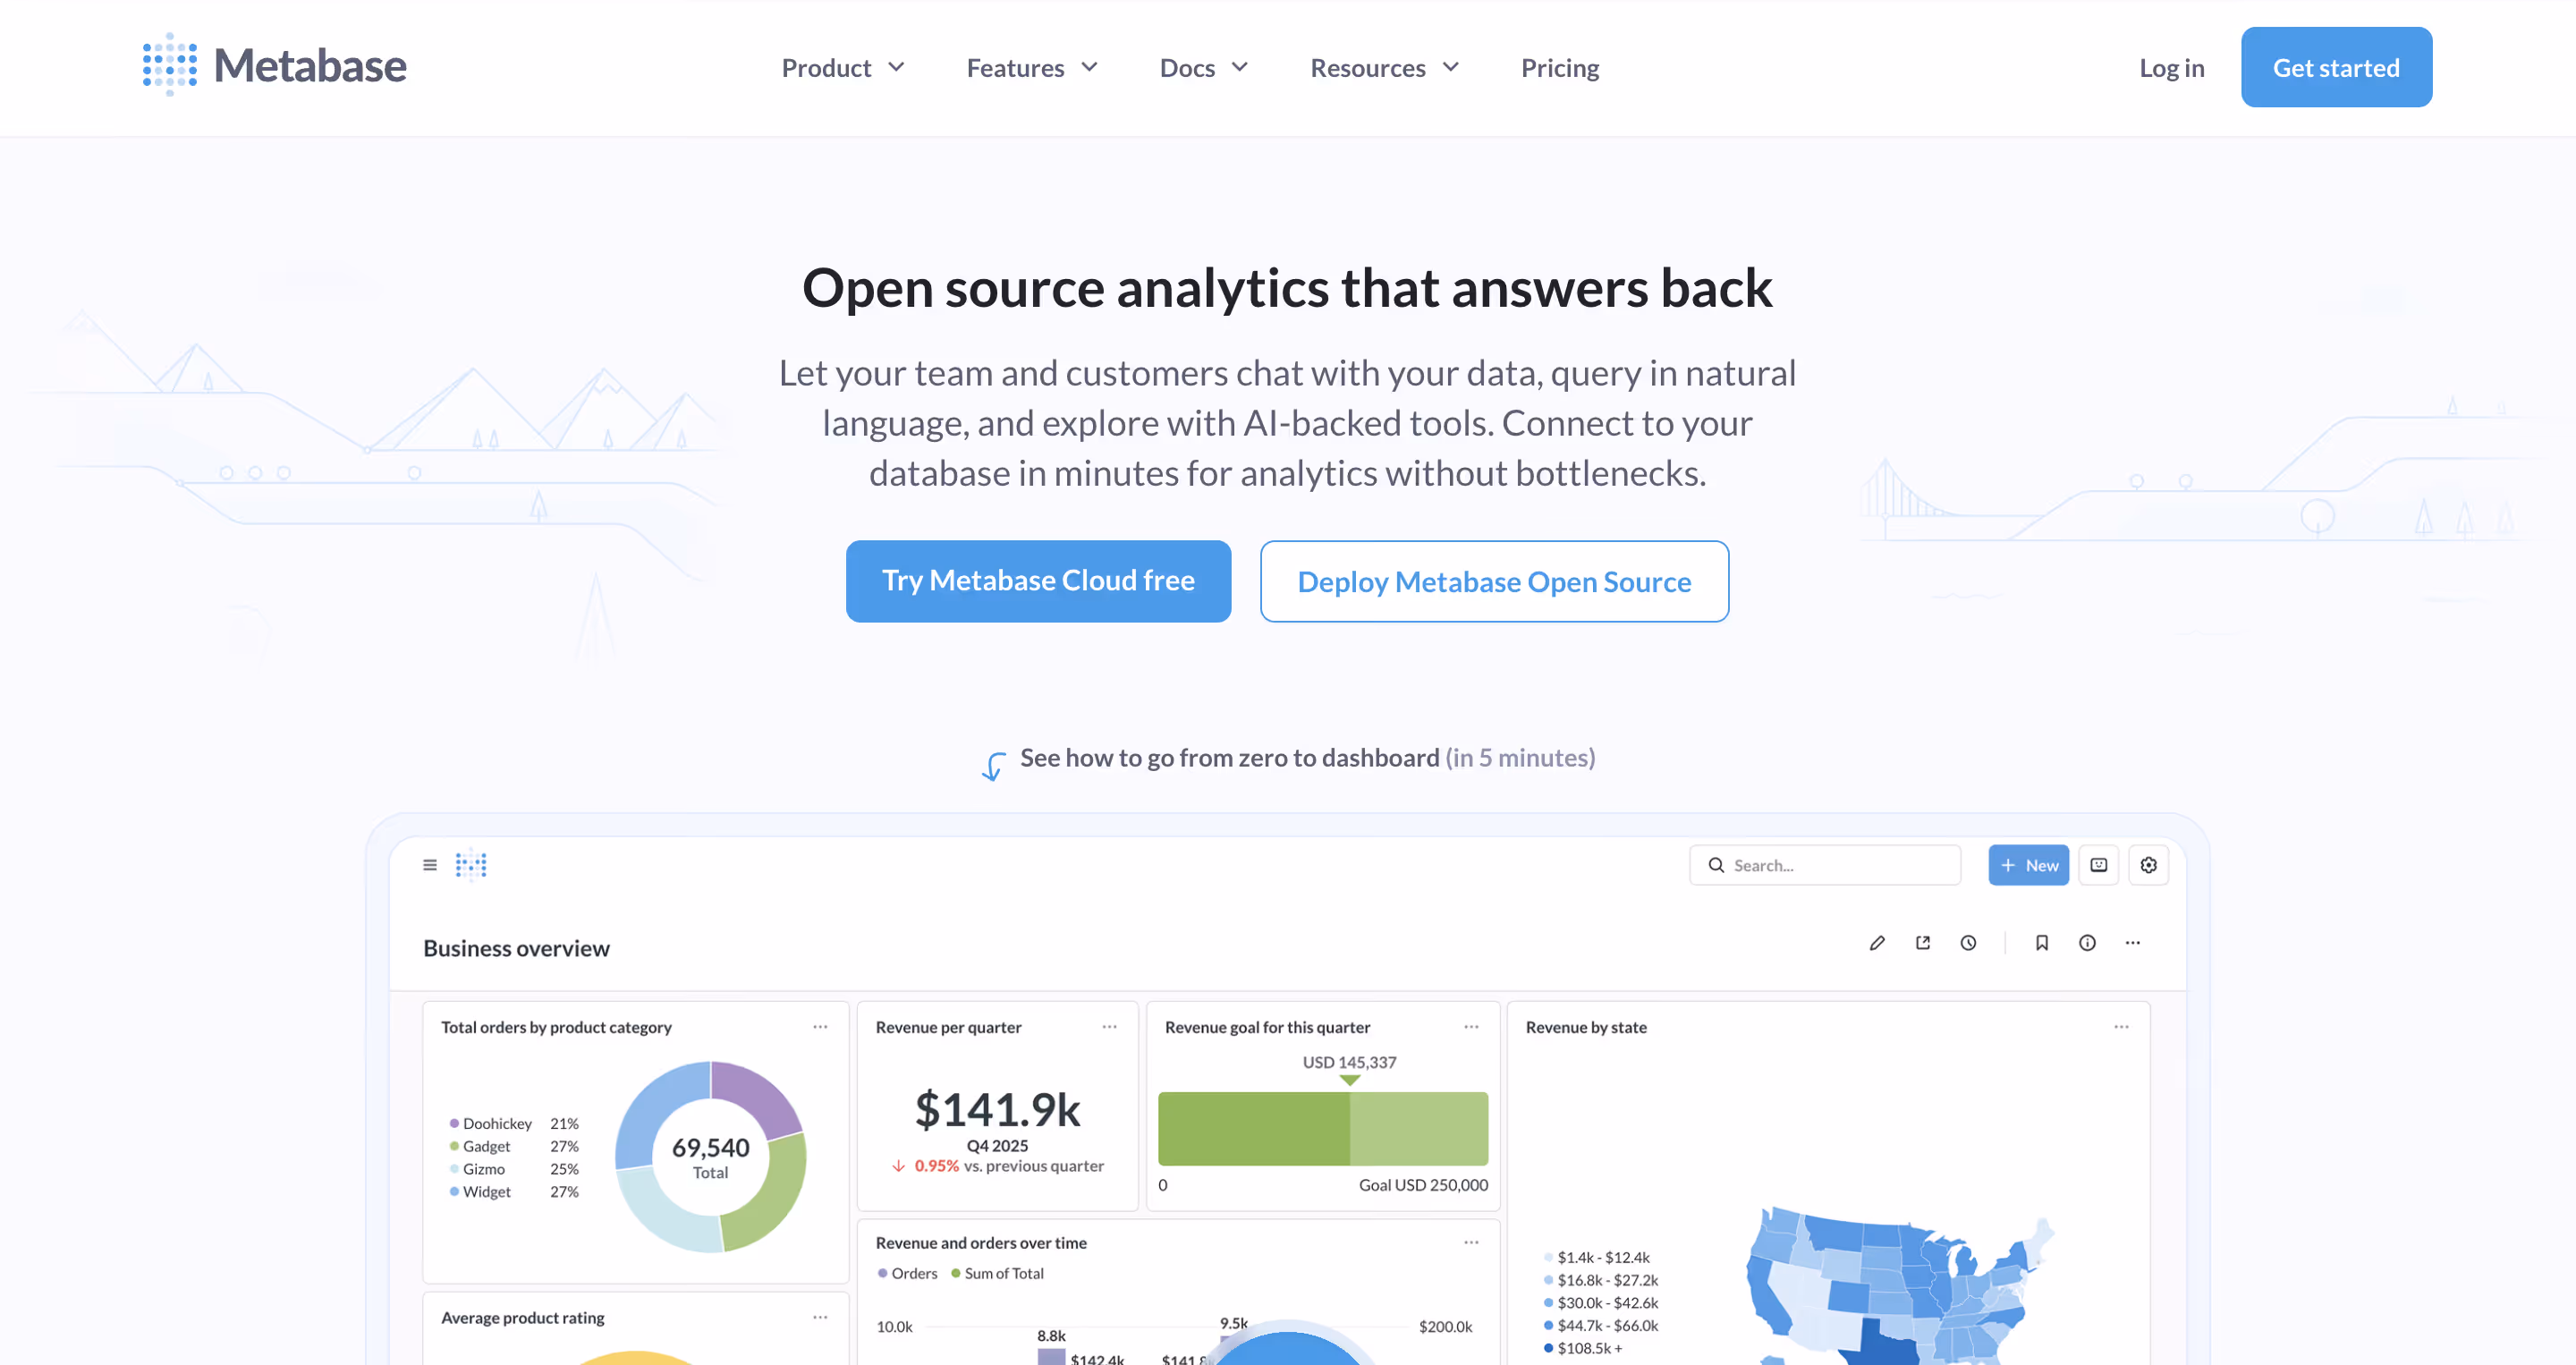
Metabase is a go-to open-source embedded analytics tool that offers a straightforward path to embedded dashboards with minimal cost. Its core features include a no-code query builder, interactive dashboards, and basic embedding, which make it an accessible analytics platform for teams with limited budgets.
Key Features
- Open-source: Free self-hosted version with community support. Cloud-hosted option starts at $85/month.
- No-code query builder: Users can build queries without SQL, making data visualization accessible to broader teams.
- Data connectors: Connects to major SQL databases, cloud warehouses, and spreadsheets via native data connectors.
- Embedding options: iframe embedding and SDK (Pro plan) for integration into applications.
- Self-service: Users can build their own dashboards and explore data, especially on the Pro plan with self-service analytics features.
Users love Metabase’s simplicity and the price (free is hard to beat). It’s praised for ease of setup and the ability to centralize data in one place. However, it’s not purpose-built for embedded use, and reviews note that it can be intimidating for non-technical users. Enterprise-grade features like advanced security, full white-labeling, and deep customization are limited or require the paid Pro plan.
Pricing
Free (open-source self-hosted). Cloud-hosted starts at $85/month for up to 5 users. Pro plan with full embedding features requires custom pricing.
Who is Metabase Best For?
Small teams, startups, or organizations that need basic embedded analytics on a tight budget and don’t mind self-hosting.
Watch Out For
Limited enterprise features in the free tier. Partial white-labeling (Pro only). AI capabilities are limited. Not designed for customer-facing embedding at scale.
10. Embeddable: Headless, Developer-First, iframe-Free
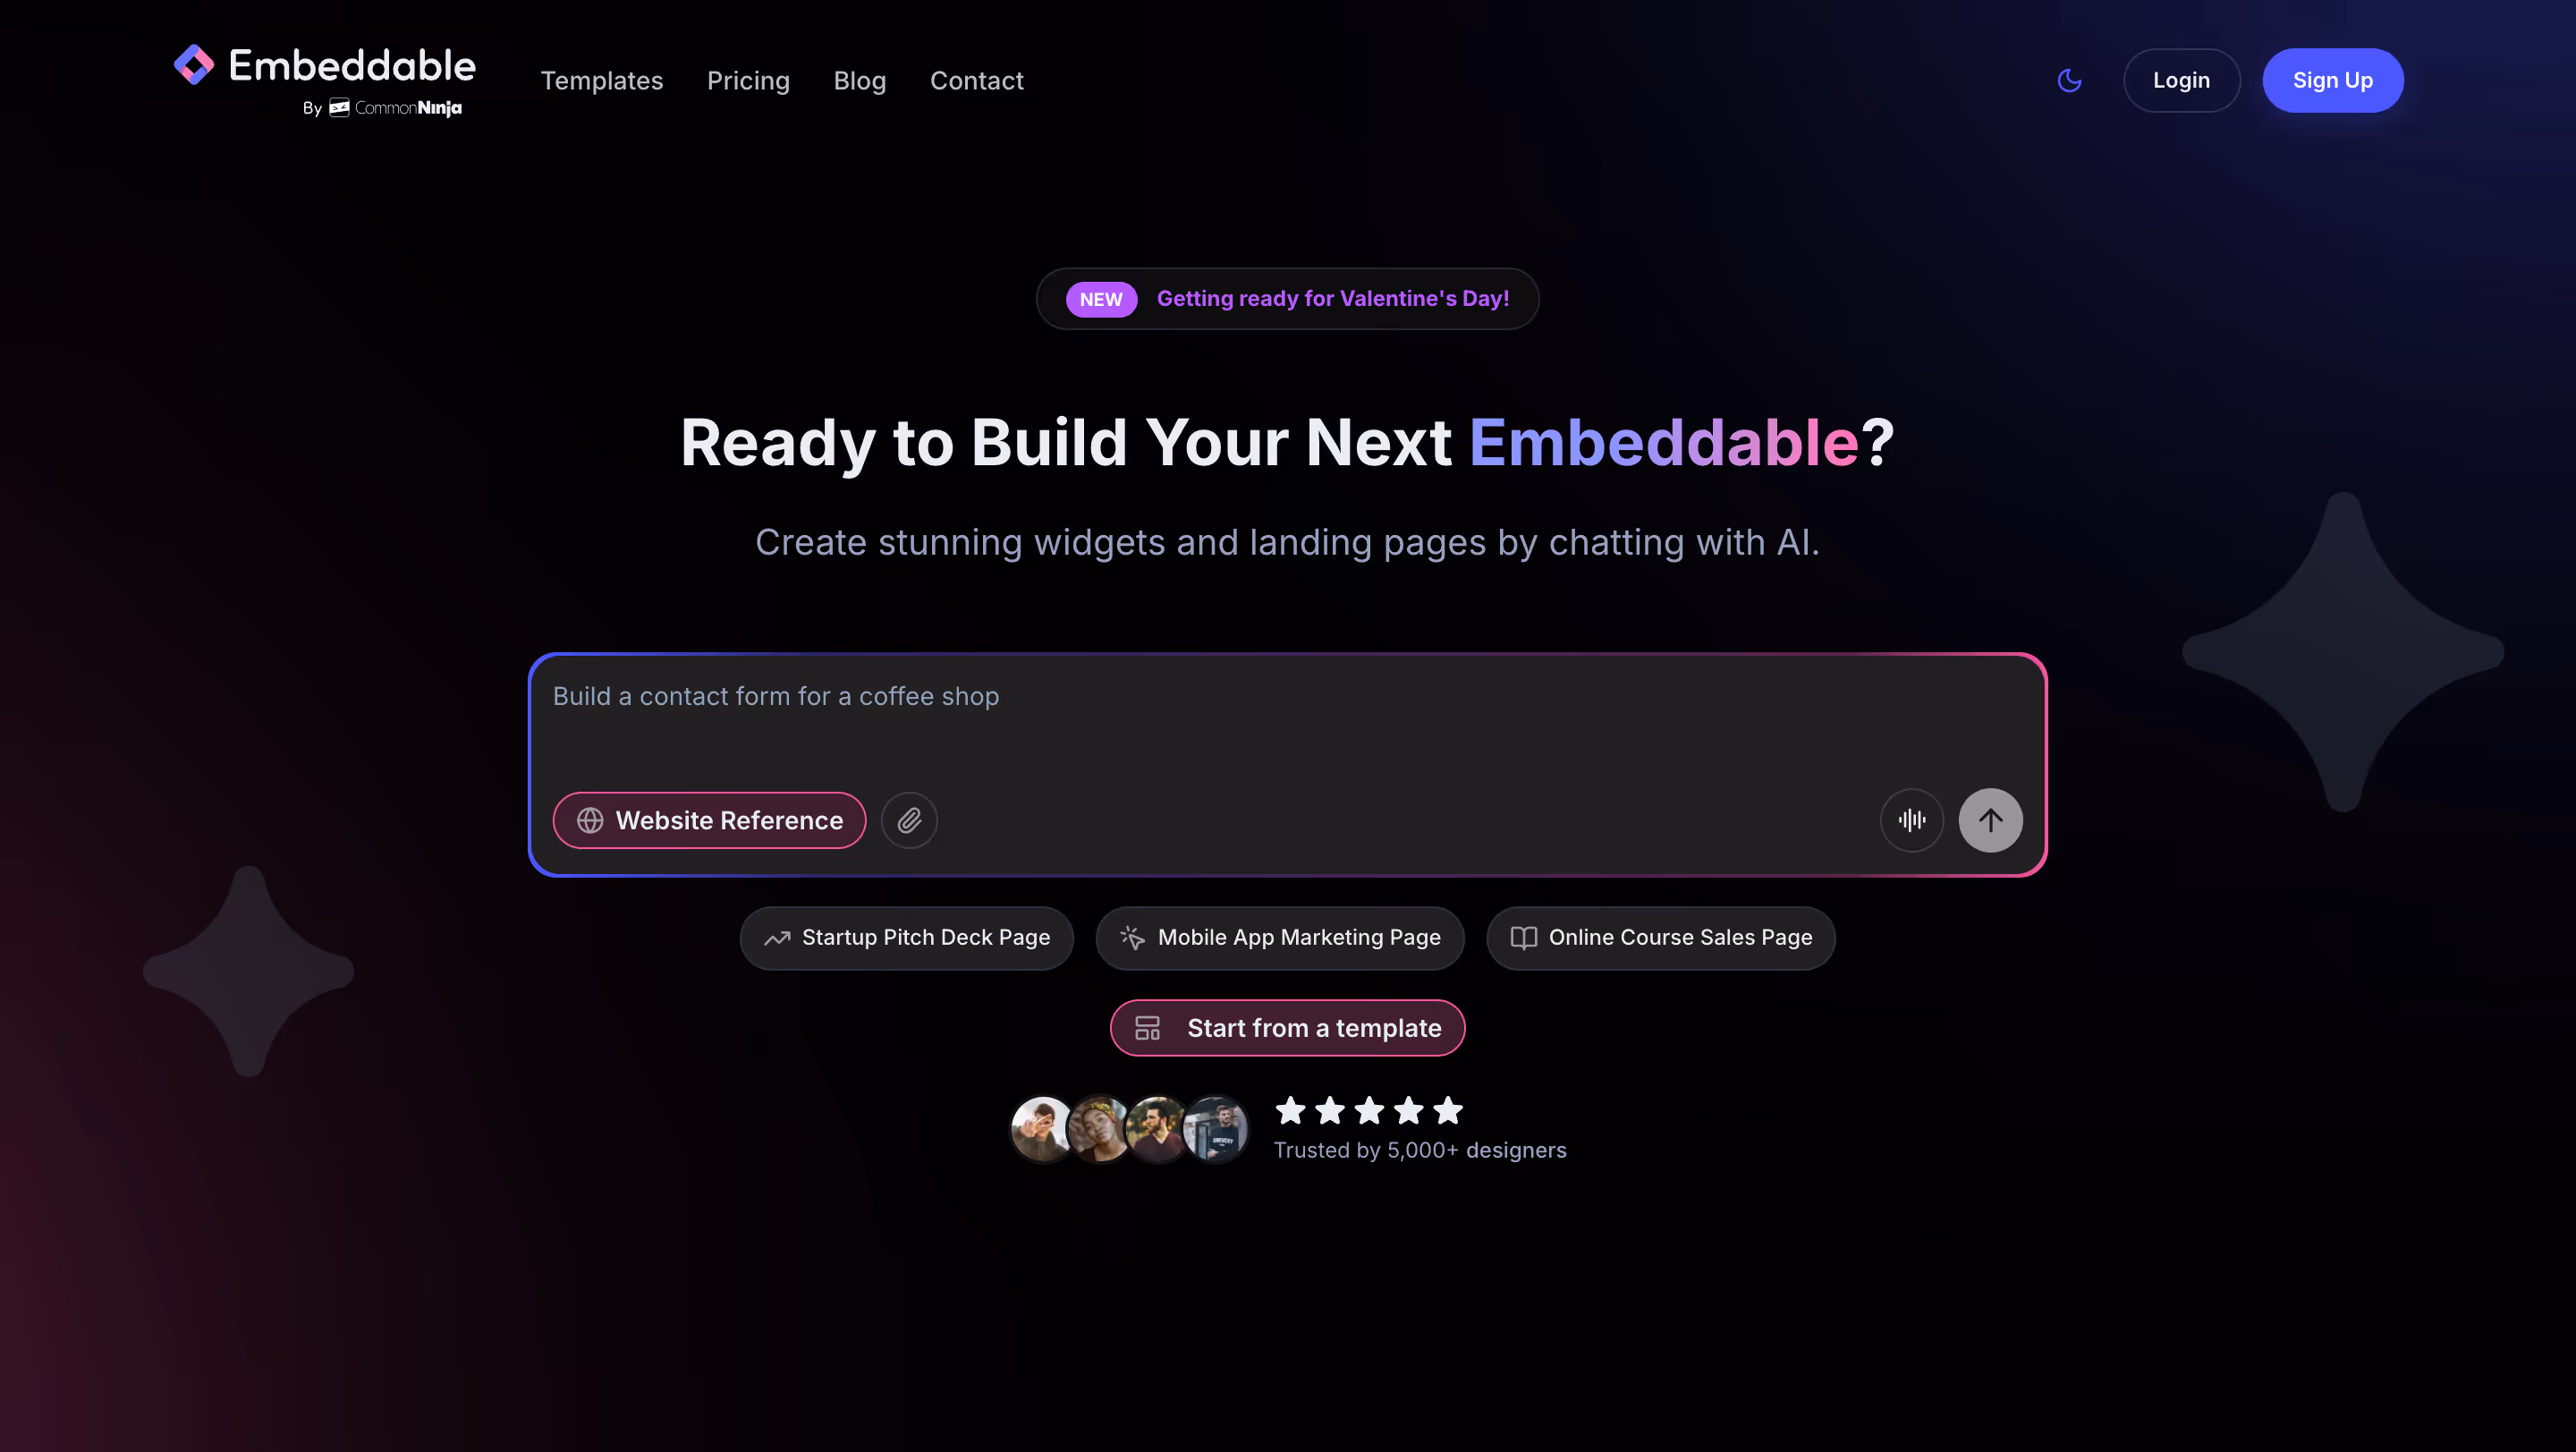
Embeddable takes a radically different approach: a headless, developer-first architecture where charts render natively in your DOM via web components, not iframes. This gives engineering teams full code-level control over the embedded experience, making it one of the most customizable embedded analytics features-focused tools on the market.
Key Features
- No iframes: Charts load as native DOM elements via web components, enabling bi-directional communication with your app and superior performance.
- Full developer control: SDKs, APIs, Git-based version control, and CI/CD compatibility. Strong integration capabilities for engineering teams.
- Full white-labeling: Complete visual control. You can bring your own charting libraries (Chart.js, Highcharts, etc.) for pixel-perfect branding.
- Performance: Two layers of built-in cache plus connections to fast databases like ClickHouse and Druid for sub-second loading.
- Flat-rate pricing: No per-user fees. Fixed monthly subscription that scales with your business. Strong data security with multi-tenant support, RBAC, and row-level security.
Developers praise the level of control and the native-feeling experience. The flat-rate pricing model is popular for teams scaling rapidly. However, Embeddable is a newer product with a smaller ecosystem and community than established tools. It requires more developer effort than no-code alternatives.
Pricing
Flat-rate monthly subscription. Custom pricing based on deployment needs. No per-user charges.
Who is Embeddable Best For?
Engineering teams building highly customized, customer-facing analytics experiences who want full code-level control and don’t want iframe limitations.
Watch Out For
No writeback. Requires developer effort, not a no-code solution. Smaller ecosystem. Semantic layer available via Cube integration but not built-in.
So, Which Embedded BI Tool Should You Actually Try?
The embedded BI landscape in 2026 is mature, competitive, and full of strong options. Legacy business intelligence platforms like Tableau, Power BI, and Looker offer deep ecosystems but carry the weight of complex licensing, limited white-labeling, and embedding approaches that often feel retrofitted. Purpose-built tools like Luzmo and Embeddable are compelling for specific use cases but come with trade-offs in features, maturity, or breadth.
When we step back and evaluate across all ten criteria, from embedding depth and self-service BI to writeback, semantic layer support, and real-world user sentiment, one tool stands out as the most complete modern option: Astrato.
Here’s why:
- It’s cloud-native from day one: no legacy baggage, no bolt-on embedding. Purpose-built for cloud data warehouses like Snowflake, Databricks, and BigQuery.
- Writeback changes the game: while every other tool on this list delivers read-only embedded dashboards, Astrato lets users update data, approve workflows, and take action directly from within the analytics experience.
- The built-in semantic layer ensures data integrity and robust data governance across all analytics workflows — define metrics once, use them everywhere.
- AI is integrated, not an afterthought: natural language querying, AI-powered insights, and the flexibility to plug in your own AI provider for conversational analytics.
- True self-service for real people: drag-and-drop dashboard building, no-code measures, and customizable dashboards that non-technical users actually use, driving genuine user adoption.
- Pricing that makes sense: starting at $12/user/month with usage-based pricing options. No vendor lock-in. Customers report 50–75% cost savings over tools like Qlik and Tableau.
Astrato isn’t the biggest name in this space, not yet. But it’s the platform that best reflects where embedded analytics is heading: live data, actionable dashboards, AI-ready, and built for the cloud from the ground up. If you’re evaluating embedded BI tools today, it’s the one worth putting at the top of your demo list.
Ready to see it in action? Book a free demo or start a free trial — no credit card required.
Ready to experience next-gen analytics?
See how Astrato runs natively in your warehouse.