Ask three people to define “a good coffee”, and you’ll get three very different answers – a double espresso, a caramel oat latte, or a cup of filter coffee.
“Data product” works the same way. Depending on who you ask, it might mean a dashboard, a dataset, or an algorithm running behind the scenes.
This article clears that up.
Key Takeaways
✨ There are two main types of data products:
1. Analytical/semantic products like a Customer 360 View or Marketing Attribution Model, which package data sets with a semantic layer, definitions, and business logic.
2. Operational/algorithmic products like Netflix’s recommendation engine or Uber’s surge pricing, which power automated decisions inside customer-facing products.
✨ This article focuses on semantic data products, the kind that business teams rely on every day for reporting, analysis, and planning.
✨ Data products are managed like real products: they have owners, lifecycles, contracts, and feedback loops.
✨ Companies that invest in them achieve faster decisions, lower costs, and more reliable insights across the enterprise.
Where the Idea of Data Products Came From
The phrase “data product” didn’t start as a Gartner buzzword. It emerged from two converging pressures in the data world:
- The failure of centralization
For years, companies chased the “single source of truth” by centralizing everything into a data warehouse or lake. In theory, it worked. In practice, it created bottlenecks: a central data team trying to serve dozens of business domains, endless queues of BI tickets, and frustrated stakeholders. - The rise of product thinking
At the same time, digital teams were getting good at managing products – apps, platforms, and services with clear owners, roadmaps, SLAs, and customer feedback loops. The idea of applying this same discipline to data started gaining traction.
In other words, data products grew out of frustration with “data as a project” and matured into “data as a product”.
This shift crystallized in Zhamak Dehghani’s 2019 introduction of Data Mesh, which put “data as a product” at the heart of its principles. Instead of treating data as an asset that sits in storage, the concept reframed it as something actively packaged, owned, and maintained by domain teams – with the same rigor as a customer-facing product.
Over time, the definition has broadened.
Two Types of Data Products
Not all “data products” are created equal. Broadly, they fall into two camps:
1. Semantic / Analytical Data Products
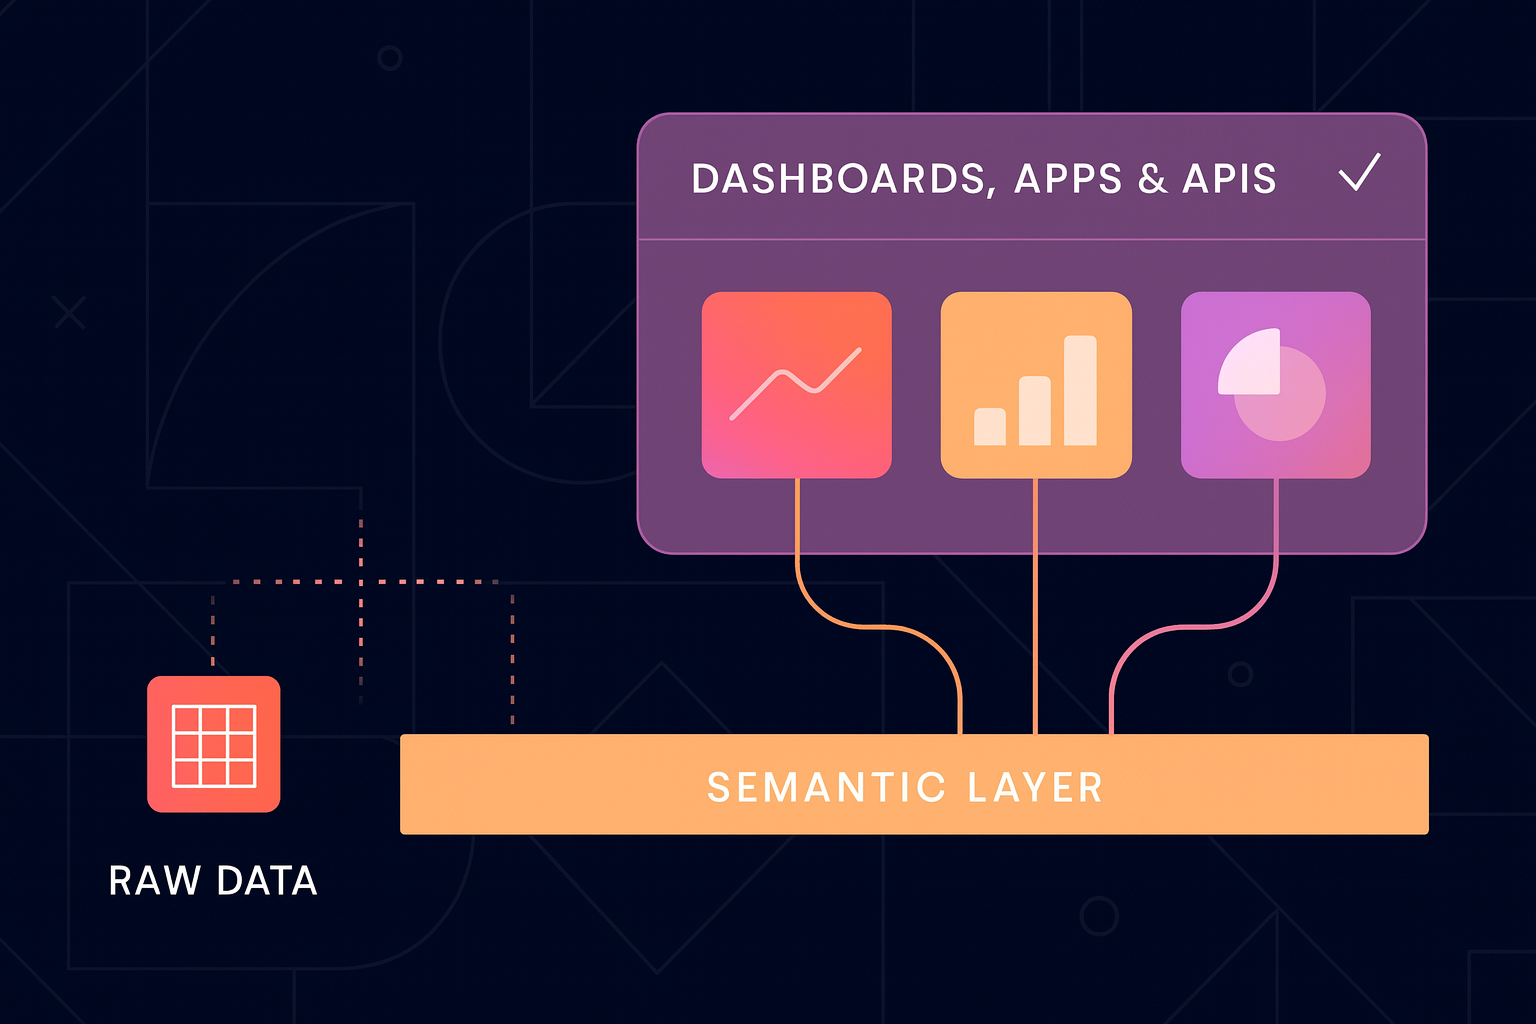
These are curated datasets enriched with business logic and a semantic layer – but critically, they’re packaged with a delivery mechanism. A semantic data product isn’t just rows in a warehouse. It comes bundled as something people can actually use: a dashboard, interactive report, embedded app, or API. Without that interface, it’s just plumbing.
- Examples: Customer 360 View, Marketing Attribution Model, Revenue Performance Package
- Purpose: Self-service access and consistent, reusable insights across domains
- Consumers: BI leaders, marketing managers, finance teams, product owners
2. Operational / Algorithmic Data Products
These run automatically in customer-facing services, usually powered by ML models.
- Examples: Netflix’s recommendation engine, Uber’s surge pricing, Gmail’s spam filter
- Purpose: Real-time, automated decision-making inside digital products
- Consumers: End users, often without realizing it
Both fit under the “data product” umbrella. But for most enterprises, the real game-changer is the semantic data product – the kind that gives every team the same definition of “customer,” “revenue,” or “churn,” and makes data reliable enough to drive decisions.
That’s our focus in this article.
The Need for Semantic Data Products
Without semantic data products, most companies are like a café swimming in burlap sacks of coffee beans. The beans are valuable, but they’re raw, unroasted, and unground. To make a cup, you need a roaster, grinder, scales, filters, and skill.
That’s what it’s like dealing with raw data: CRM exports, ERP extracts, web logs, ad campaign spreadsheets. They’re technically useful, but scattered, inconsistent, and hard to work with. To turn them into insight, analysts and data engineers spend hours “grinding” and “filtering” – cleaning, transforming, reconciling definitions.
A data product is the coffee pod. The beans are already roasted, ground, measured, sealed, and labeled. Drop it into the machine and you get a consistent cup every time. Business users don’t need to learn how to roast or grind – they just brew and trust the result.
That’s the difference: raw beans (datasets) vs. coffee pods (data products). One requires specialist prep every single time, while the other is ready to use, repeatable, and reliable.
Have you seen this before?
Picture this:
The CFO pulls up a revenue dashboard that shows $98 million last quarter.
Marketing’s report shows $105 million.
Sales insists it’s $102 million in their pipeline view.
Who’s right?
Here’s the catch: they might all be right – in their own worlds.
- Finance is looking at recognized revenue.
- Marketing is looking at ARR: forward-looking recurring revenue.
- Sales is looking at C-ARR: contracted ARR, including deals not yet started.
Individually valid, but collectively confusing. This is what happens when every team defines and calculates differently. Data silos fracture the view, incomplete data makes reports unreliable, and business users lose trust.
A semantic data product solves this. Take the Customer 360 View. Instead of every team pulling customer data from Salesforce, SAP, Marketo, HubSpot, and support logs – and reconciling it their own way – the product packages everything into a single, governed dataset. It comes with:
- Agreed definitions (what counts as an “active customer”).
- Business logic (how to calculate churn or lifetime value).
- A semantic layer that makes the product discoverable and usable in BI tools.
- Delivery mechanisms (APIs, SQL views, dashboards, reports) so any data consumer can tap into it.
Now, when Marketing, Sales, and Finance talk about “customers” or “revenue”, they’re not talking past each other. They’re looking at the same trusted source, framed in the right context.
That’s the power of semantic data products: trust, consistency, and speed.
Characteristics of Semantic Data Products
For semantic data products to succeed, they need to serve both business stakeholders and data teams.
At their core, great data products rest on two pillars: trust and user experience. Trust means everyone can rely on the numbers as there are no hidden formulas or conflicting definitions. User experience means the product is actually usable: self-serve, well-documented, and consumable without a ticket to IT. Without both, it’s just another dataset with a new label.
From the business side, a product must:
- Provide a clear identity and owner (usually a domain team).
- Include context, definitions, and metrics alongside the data.
- Be easy to consume without relying on IT tickets (usually via self-serve visualisation layer like Astrato).
- Be reliable and transparent, with contracts and refresh cycles.
From the technical side, the product must:
- Be discoverable in a catalog, with plain-language metadata.
- Include monitoring and validation to guarantee data quality.
- Apply access controls and governance to protect sensitive information.
- Follow a lifecycle of design, release, growth, and retirement.
Beyond functionality, data products also need to guarantee non-functional attributes: reliability, concurrency, response time, uptime and continuous improvements.
These are the invisible qualities that make the product dependable at scale, and they matter just as much as the metrics inside it.
That combination is what transforms a dataset into a product: usable, trusted, and sustained over time.
The Semantic Layer: What Turns a Dataset Into a Data Product
Here’s a truth most data leaders know too well: datasets by themselves don’t solve business problems.
Imagine you’ve built a Customer 360 dataset. It pulls records from Salesforce, support logs, marketing systems, and billing. On paper, that sounds like a win. But without a semantic layer, here’s what happens:
- Marketing uses “customer” to mean any lead with an email address.
- Finance defines “customer” as anyone who has paid in the last 12 months.
- Support says it’s any account with an open ticket.
So even though everyone’s querying the same dataset, they’re still arguing over which numbers are right. That’s not a data product – that’s just a pile of beans with no pod.
The semantic layer is what changes the game.
It’s the layer of business logic, definitions, and agreed-upon metrics that sits on top of the raw data. It abstracts away technical details and presents the data in business terms everyone can understand.
With a semantic layer:
- “customer” is defined once and applied everywhere.
- “Churn” or “lifetime value” aren’t formulas hidden in someone’s Excel sheet – they’re metrics embedded in the product itself.
- Time periods like “YTD” are calculated consistently, even if different business units run on different fiscal calendars.
- Business users don’t have to decode SQL or guess which version of the truth to trust.
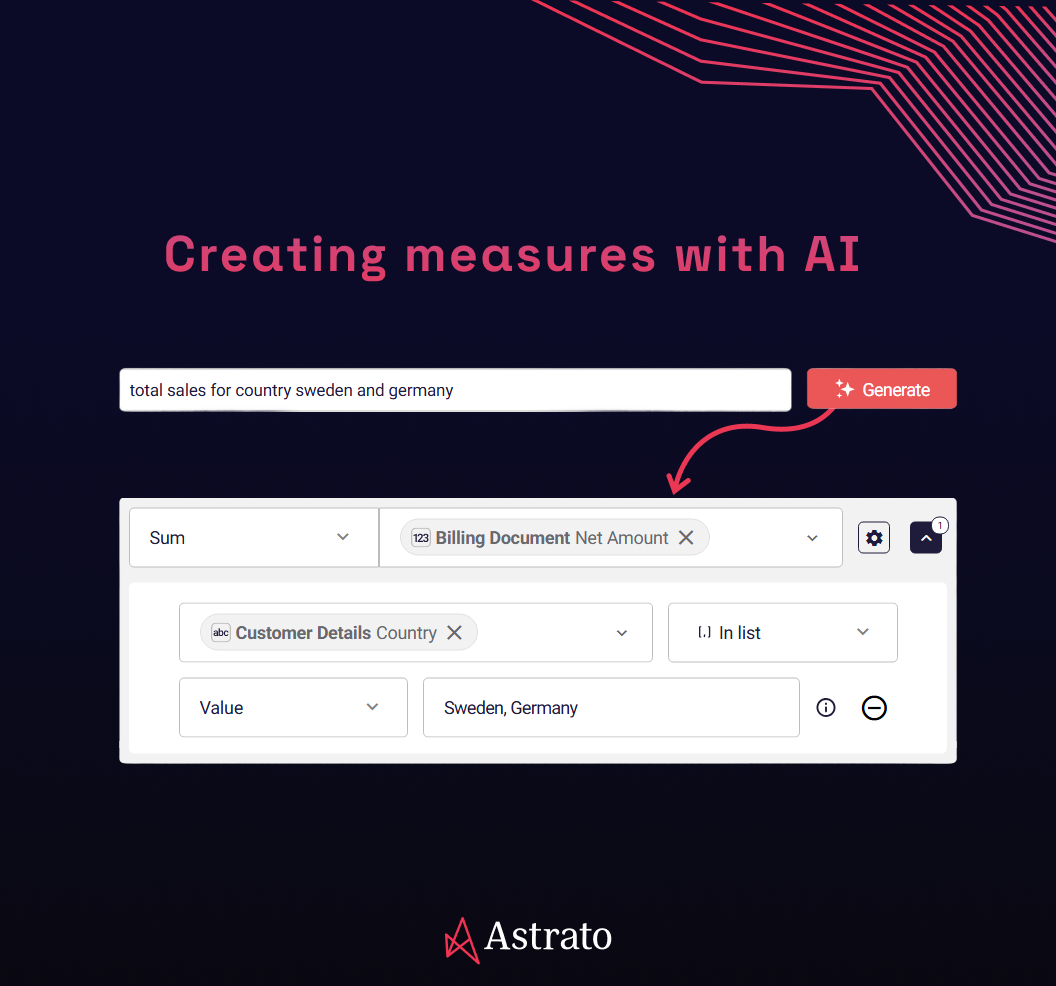
And this is exactly how we’ve designed Astrato’s Semantic Layer Editor. Sitting directly on top of live cloud data in Snowflake, BigQuery, or Databricks, it lets you:
- Model your data visually: set up joins between tables, rename fields into business-friendly terms, and preview results instantly.
- Define metrics and logic once: create reusable measures and dimensions – like “Active Customer” or “Net Revenue” – that apply consistently across every dashboard, report, or app.
- Add context with custom data: blend in a CSV, run custom SQL, or create inline lookup tables directly inside the semantic layer.
- Apply governance: set default formats, manage access levels, and enforce refresh cycles and SLAs.
- Leverage AI tools: automatically generate joins and rename fields to speed up modeling.
Because Astrato is a cloud-native BI platform with a built-in semantic layer, every definition you create is immediately consumable. You don’t just have a clean data model sitting in the warehouse – you have a living data product delivered as a dashboard, interactive workbook, or full data app.
That’s the difference:
- A dataset alone is like coffee beans in a sack – valuable, but raw and hard to use.
- A semantic data product in Astrato (for example, an embedded dashboard) is the coffee pod – packaged, consistent, and ready for anyone in the business to “brew” insights instantly.
Now, to make this concept watertight, let’s look at what a data product isn’t.
What a Data Product Isn’t
One of the biggest challenges with the term data product is that it gets slapped on anything vaguely data-related. A dashboard? Data product. A SQL view? Data product. A data warehouse? Sure, why not.
But calling everything a data product waters the idea down until it means nothing. So let’s be clear about what isn’t a data product:
- A dashboard isn’t a data product on its own. Dashboards are often the interface for a data product – the way business users interact with the numbers. But unless the data underneath is packaged with ownership, a semantic layer, contracts, and governance, a dashboard is just a visualization. It can be part of a data product, but only if it’s backed by the other characteristics that make the numbers reliable.
- A table in your warehouse isn’t a data product. A table is raw storage. Without the semantic layer, it’s just a bag of beans waiting for someone to grind.
- A pipeline isn’t a data product. Pipelines are plumbing. They move data from one place to another. Critical, yes, but not consumable by business users on their own.
- Even the data warehouse itself isn’t a data product. It’s the platform, not the product. A warehouse is like the factory floor: it provides the machinery and storage. But the product is what comes off the line – clean, packaged, ready to use.
This distinction matters because if you call every artifact a product, you risk product washing. Suddenly, publishing a half-cleaned dataset to SharePoint counts as “building data products”. But that’s not what data consumers need.
A true data product is a curated, governed, and consumable package that business users can trust. It has an owner, a semantic layer, data contracts, access controls, and – critically – a visualization or consumption layer. Without a way for people to actually see, explore, or interact with the data, it’s just plumbing or storage. With visualization, it becomes something the business can use to make decisions.
Internal Data Marketplaces: How Products Get Discovered
Even the best-designed data products won’t create business value if nobody knows they exist. That’s why many organizations build an internal data marketplace – a central hub where data products are published, documented, and consumed.
Think of it as an internal app store for data. Each product (say, Customer 360 or Marketing Attribution) comes with:
- A clear description of the business problem it solves.
- Metadata and documentation explaining definitions and metrics.
- Ownership info, so users know who maintains it.
- Access methods – dashboards, SQL views, APIs – clearly listed.
- Refresh cycles, documentation and SLAs, so expectations are set up front.
Different Consumers, Different Needs
This is where the marketplace really shines: it recognizes that not all data consumers are the same.
- Business consumers (like a marketing manager, product lead, or finance analyst) don’t want to wrangle APIs or join tables. They need ready-to-use, visualized data products – dashboards, embedded apps, or curated reports that surface the agreed-upon metrics. For them, a data product only becomes real when they can log in on Monday morning, pull up “Customer 360,” and instantly see trusted, up-to-date numbers.
- Technical consumers (data scientists, data engineers, advanced analysts) may want deeper access. For them, the marketplace provides SQL views, APIs, or semantic models that allow them to extend, recombine, or feed machine learning models with the same governed source of truth.
By serving both groups in one place, the marketplace prevents the all-too-common problem of multiple “truths.” Everyone – from the SQL-heavy analyst to the CMO – consumes from the same product, just through different interfaces.
Why It Matters
For business users, the marketplace turns data from something hidden and IT-owned into a visible, discoverable service. No more digging through SharePoint folders or emailing the BI team to ask, “Do we have campaign ROI numbers?”
And that’s the best-case scenario – when people already know to ask. More often, business users don’t even realize certain datasets exist, so they never request them. Valuable insights sit unused simply because they’re invisible.
For technical teams, the marketplace enforces data contracts. Publishing a product means committing to definitions, refresh cycles, and access rules – ensuring consistency and accountability across business domains.
In short, the marketplace is where the product thinking really comes alive. You don’t just build a Customer 360 dataset – you package it, publish it, and make it discoverable. That’s what turns raw data into a real data product.
Why Data Products Drive Business Success
The payoff of semantic data products shows up fast.
- Speed: Instead of analysts spending weeks cleaning data, teams can answer questions in hours. A Marketing Attribution product, for example, lets campaign managers see ROI across channels without stitching spreadsheets together.
- Cost & time savings: Shared definitions eliminate duplicated work and wasted effort. A Revenue Performance product prevents Finance, Sales, and Marketing from each building their own versions of “revenue,” cutting down not just on tooling and storage costs but also on the hours lost reconciling inconsistent numbers.
- Better decisions: Consistency builds trust. Leaders stop second-guessing dashboards and start acting on them.
And there’s another shift: data teams move from ticket-takers to value creators.
When metrics and definitions are standardized in semantic data products, the constant flow of “Can you fix this report?” tickets dries up. Instead, data teams spend their time building new products, experimenting with advanced analytics, and directly shaping business strategy. In other words, they become more value-oriented.
Data-as-an-Asset vs. Data-as-a-Product
Traditional data management treated data as an asset to be stored and optimized. Success was measured in storage capacity, uptime, and query speed.
But data sitting in storage isn’t valuable unless someone can use it.
Treating data as a product shifts the focus: ownership moves to domain teams, metrics shift to business impact, and packaging makes data consumable.

The Lifecycle of a Semantic Data Product
What makes a dataset a product isn’t just the data inside – it’s the product management discipline wrapped around it.
Like any product, a data product needs an owner, a roadmap, contracts (SLAs, refresh cycles), and feedback loops. Without these, it’s just a one-off project that slowly decays instead of something sustained and improved over time.
Semantic data products evolve through stages:
- Discovery: Identify the business objective (e.g., unify customer records for churn analysis).
- Design: Define schemas, logic, and access patterns. Write the data contracts.
- Development: Build pipelines, transformations, and semantic layers. Document everything.
- Consumption: Deliver the product in a usable format: dashboards, reports, or data apps on top of the semantic layer.
- Deployment: Release with monitoring, governance, and self-service access.
- Growth: Collect customer feedback, monitor usage, and improve.
- Maintenance: Refresh cycles, compliance checks, and performance tuning.
- Retirement: Sunset gracefully when business needs change.
On paper, that looks like a long, waterfall-style process. But with modern, no-code tools like Astrato, you can cycle through these stages quickly. Instead of waiting months, data teams can ship a minimum viable data product – say, a lightweight Customer 360 dashboard – in days or weeks, then refine it based on real user feedback.
That lean-product approach matters. The faster you deliver something consumable, the faster business users start making decisions with it – and the faster you can improve the product to deliver more value.
Examples of Semantic Data Products
Flashy cases like Netflix or Uber are great for recognition. But in most enterprises, the real workhorses look like this:
- Customer 360 View: Consolidates data from CRM, support systems, and marketing platforms into a single source of truth. Used across Sales, Marketing, and Finance.
- Marketing Attribution Model: Combines web analytics, ad spend, and CRM data to show which channels drive ROI.
- Revenue Performance Package: Brings together ERP, CRM, and financial data to provide a consistent view of revenue across teams.
- Product Master: Unifies SKUs and product data across systems, avoiding errors in reporting and inventory planning.
- Employee Performance Dataset: Combines HR, payroll, and productivity systems into a consistent view of workforce performance.
These aren’t glamorous, but they’re transformative. They eliminate silos, build trust, and free data teams from endless reconciliation work.
Final Word
There are two kinds of data products: the flashy algorithmic ones you see at Netflix and Uber, and the semantic-layer products that quietly transform how enterprises operate.
Both matter. But if your goal is to align teams, speed up decisions, and build trust in data, start with the semantic side. Package your messy, fragmented datasets into products – Customer 360, Revenue Performance, Marketing Attribution – and make them discoverable, governed, and consumable.
That’s how you move from having data to using data.
And that’s how your organization stops staring at three different revenue numbers – and starts making faster, smarter business decisions.
FAQs
How long does it take to build a semantic data product?
With traditional tools, weeks to months. With Astrato, you can connect live cloud data, define your semantic layer, and build consumable data apps in hours. Complexity still varies (a Product Master vs. a full Customer 360), but the speed-to-value is dramatically faster.
Is a data product just a dashboard?
No. A dashboard is a visualization layer. A data product includes the data, logic, contracts, and semantic layer that make the numbers trustworthy across tools.
How do you measure ROI?
By outcomes: fewer duplicated efforts, faster analysis, more consistent decisions. Example: a Customer 360 product reduces prep time by 40% while improving campaign ROI by millions.
Do small companies benefit?
Yes. Even a 50-person startup can create a lightweight data product – like a simple Customer 360 – and scale it as they grow.


.avif)


