
You’ve probably seen this dashboard before: a line chart showing quarterly revenue inching upwards. 📈 Useful? Yes. But…
What if you want to compare Q2 this year to Q2 last year, see which regions are accelerating or slowing, or understand whether customers are buying accessories in the same pattern as the main product?
In SQL, you’d need window functions, nested queries, maybe even custom scripts. In Excel, you’d be juggling multiple tabs and formulas.
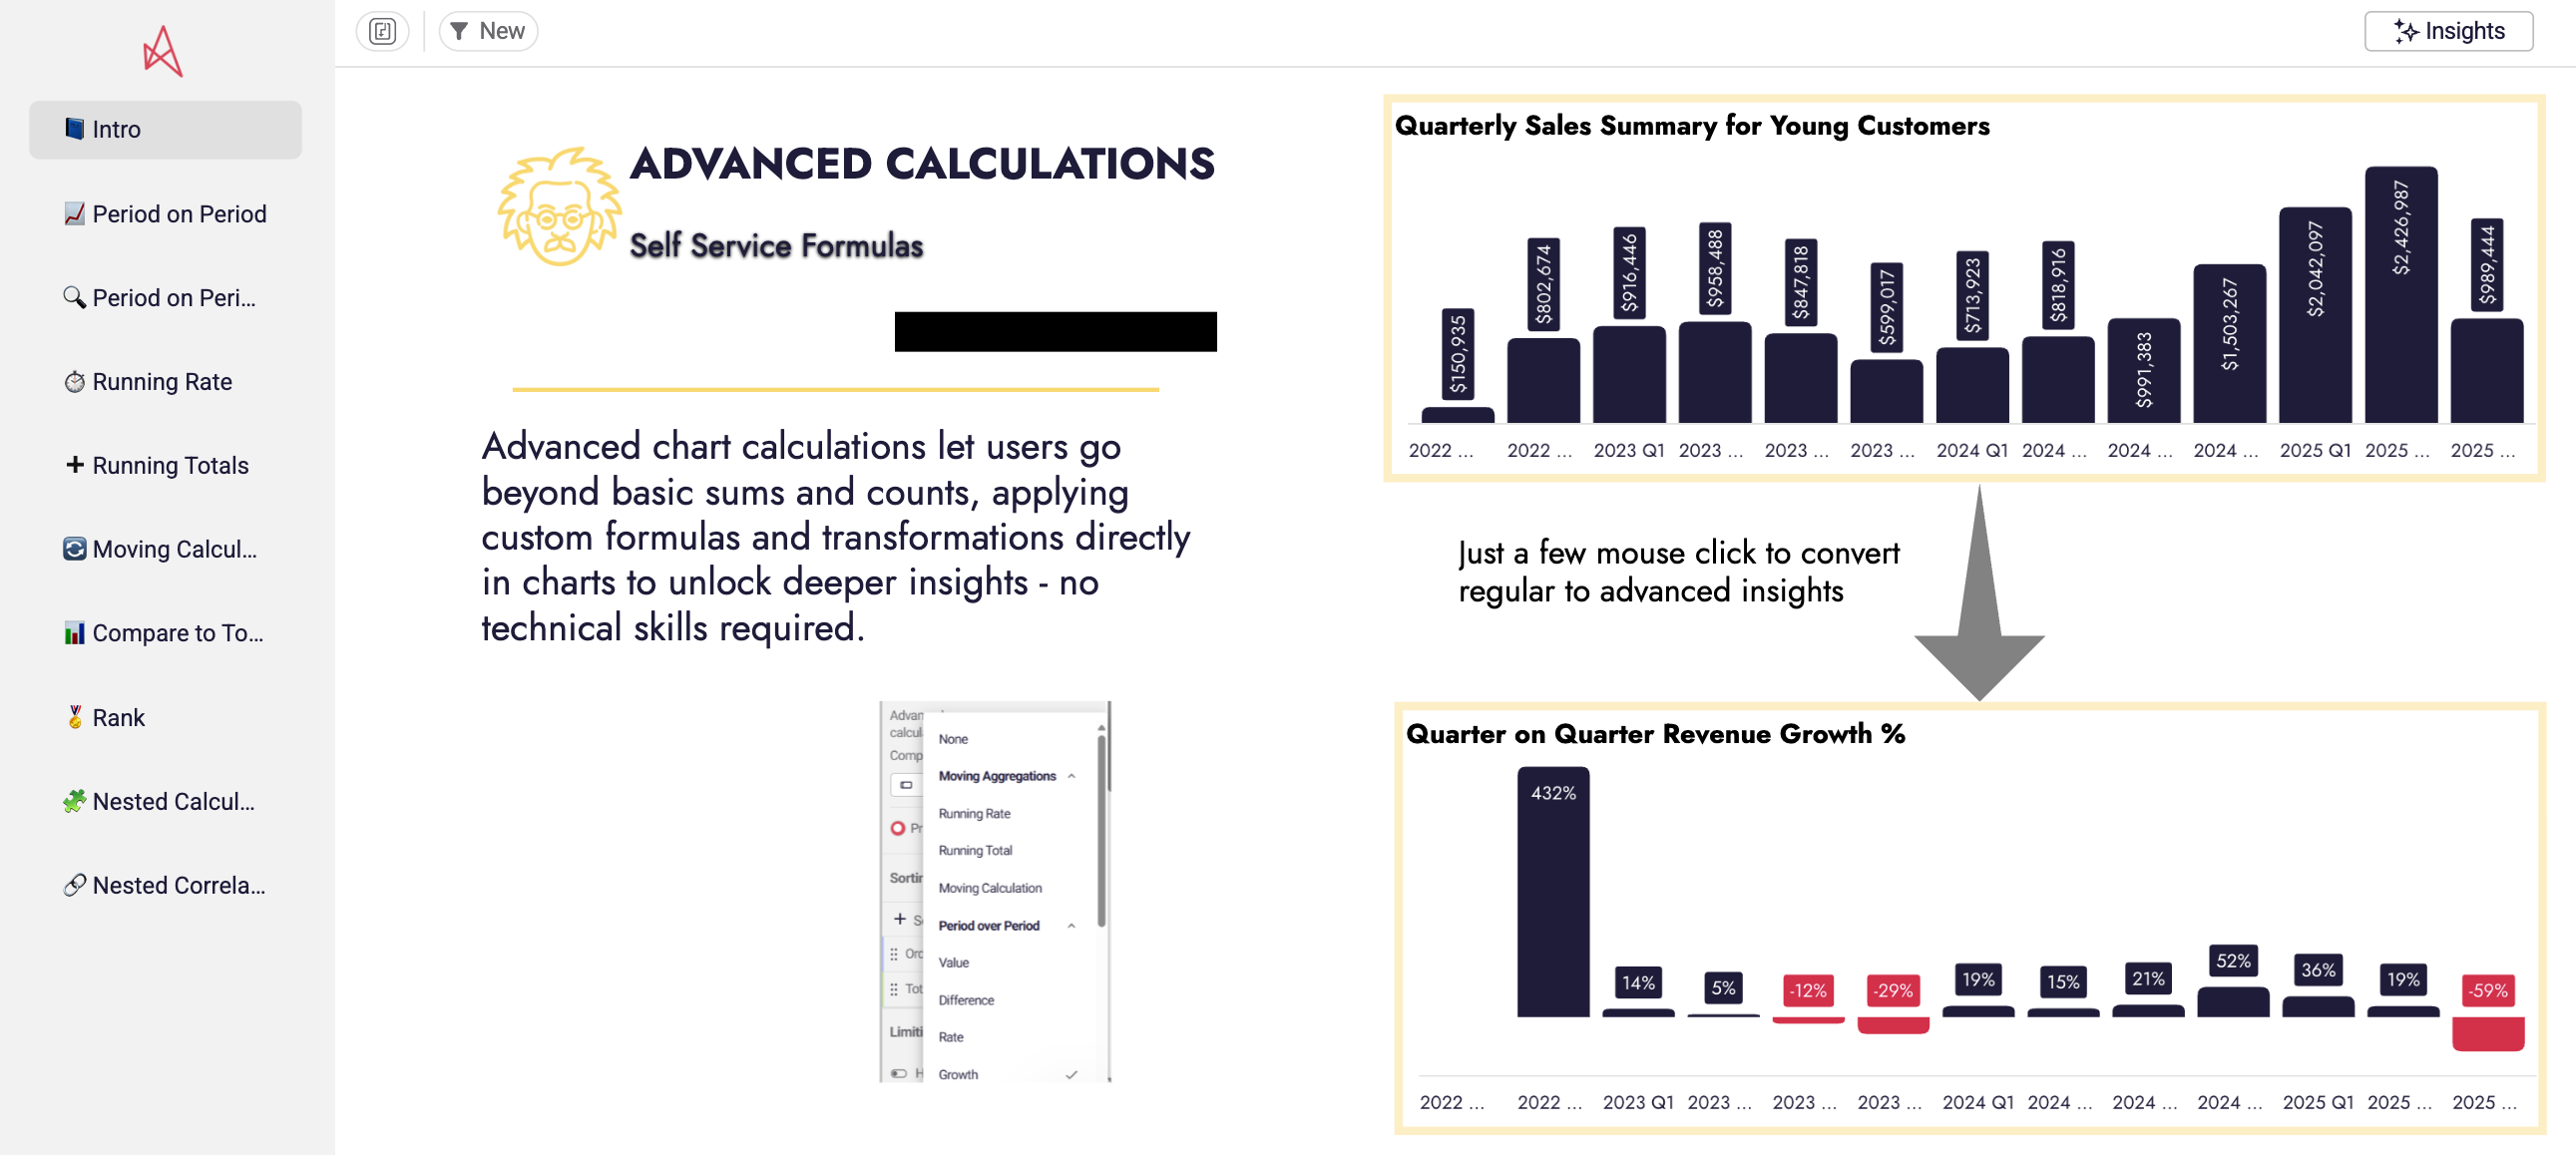
Astrato takes a different path. With Advanced Calculations, you can perform these kinds of analytical functions – period-over-period comparisons, running totals, moving averages, ranking, and segmentation – without writing a single line of code.
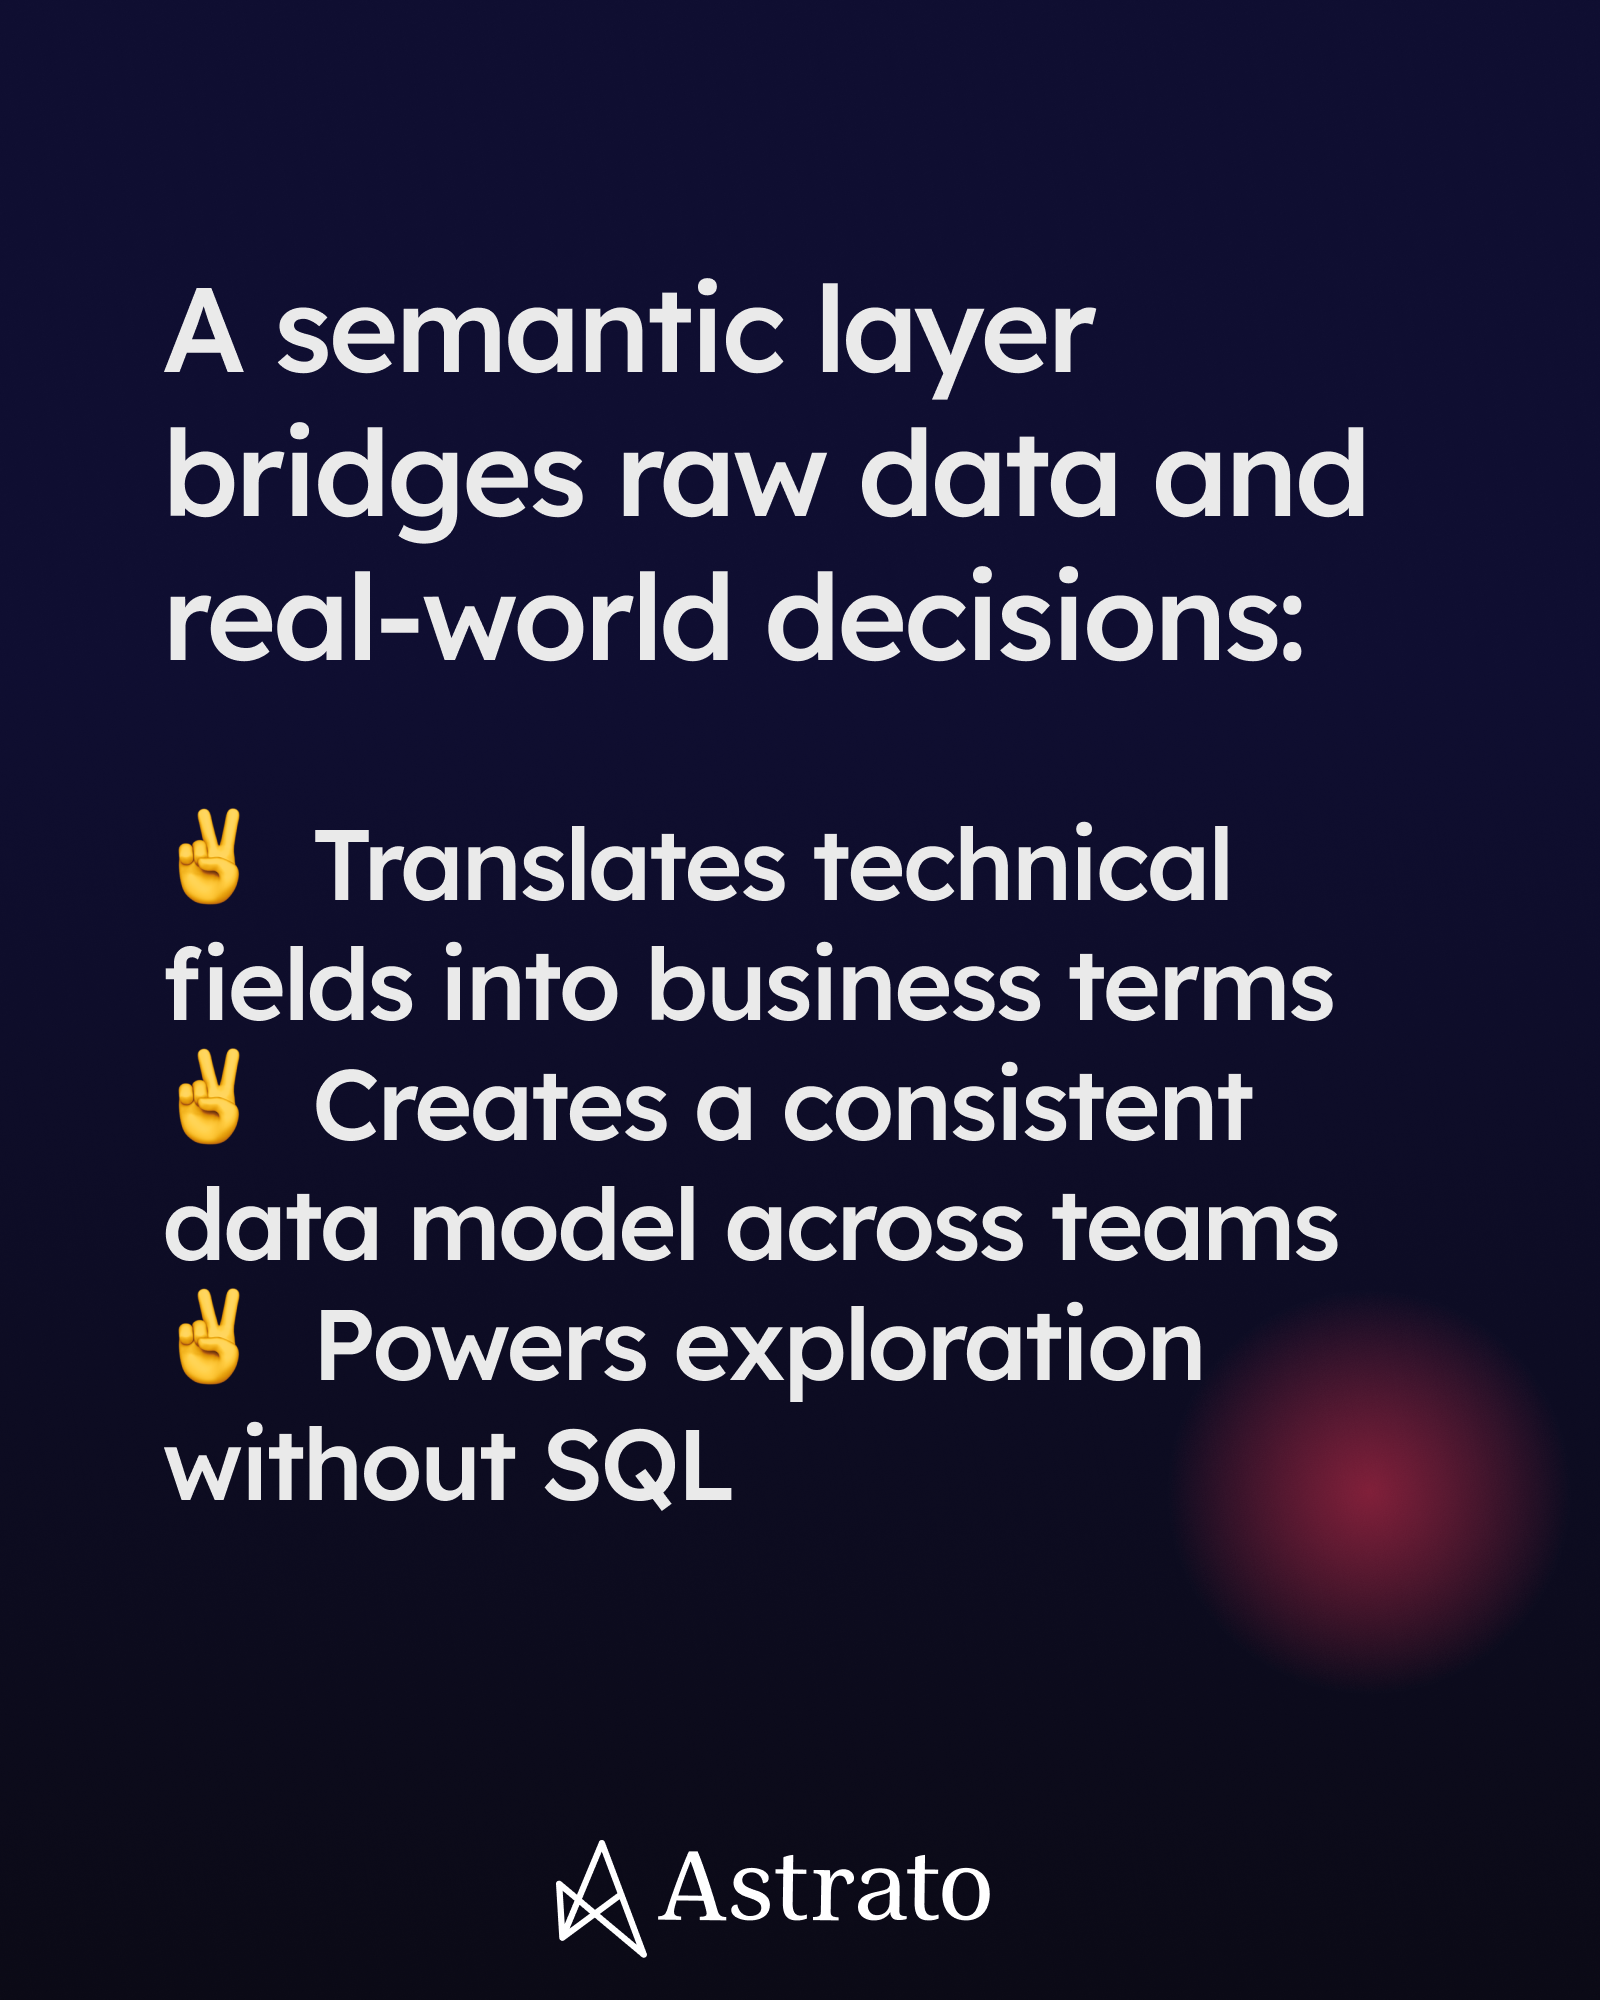
And because they sit on top of Astrato’s Semantic Layer, the results are always consistent with your business definitions. No more “Finance vs. Marketing” debates over what net revenue really means.
P.s. This blog is a summary of our recent webinar on advanced calculations. You can watch it here!
What are Advanced Calculations (Analytical Functions)?
At their core, advanced calculations (also known as analytical functions or window functions) are operations that let you:
- Compare values over time.
- Accumulate results across periods.
- Smooth noisy data into trends.
- Rank and segment entities like products, customers, or markets.
They go beyond sums and averages – they give you the second layer of logic that turns raw numbers into business stories.
Advanced Calculations vs. Calculated Measures
- Calculated measures = new metrics you define manually (e.g., Gross Margin = Revenue – Cost ÷ Revenue).
- Advanced calculations = higher-order operations you apply on top of measures (e.g., Gross Margin YoY growth, ranked by region).
In SQL, this usually means learning functions like LAG(), RANK(), PARTITION BY. In Astrato, it means a few clicks.
And because Astrato’s Semantic Layer manages the definitions of “Revenue,” “Active Users,” or “Churn,” your advanced calculations always use consistent, governed logic.
💡Tip: Think of a calculated measure as defining a new metric – like Gross Margin. Advanced calculations involve using it to compare Gross Margin growth year-over-year or rank it across regions.
Why Advanced Calculations Matter in Business Analytics
Basic dashboards answer what happened. Advanced calculations help you explain why it happened – and what to do next.
Spot trends earlier with moving averages
A moving average smooths out short-term noise so the real trajectory becomes clear. For example, instead of chasing every spike in daily sales, you can see that weekly demand is slowly tapering off – a warning sign to revisit your forecast before it’s too late.
Uncover hidden shifts with ranking
Ranking lets you see who’s moving up and who’s slipping down. A product that looks “steady” in absolute numbers might actually be climbing the leaderboard when compared to peers, while another quietly loses ground. Those shifts can guide where to invest or intervene.
Compare fairly with running rates
When metrics live on different scales, it’s hard to judge them side by side. Running rates level the playing field, showing relative pace instead of absolute totals. That means you can track whether website sign-ups and app downloads are growing in sync, even if one always dwarfs the other in raw numbers.
Build trust with consistent definitions
Advanced calculations are only as good as the measures behind them. If Finance and Marketing calculate “revenue” differently, your period-over-period chart won’t settle any debates. That’s where Astrato’s Semantic Layer comes in: it locks in business-ready definitions, so every team is working from the same source of truth.
In short: self-service doesn’t have to mean shallow analysis. Together, these functions let you move from static reporting to dynamic analysis that explains not just the numbers, but the story behind them.
The Challenge with Legacy BI Tools
In most organizations, advanced analysis has lived in two extremes. 🔥🧊
On one side, there’s SQL. Analysts could unlock powerful insights with window functions, CTEs, and nested queries – but only after hours of coding. For non-technical business users, these functions were intimidating, inaccessible, and often meant waiting days for someone else to deliver answers.
On the other side, there’s legacy “self-service” BI. In an attempt to make analytics simple, many platforms stripped out advanced features altogether. Business users were left with little more than sums and averages – and when they needed something deeper, they fell back on Excel or sent urgent requests to analysts.
The result? Analysts drowning in ad-hoc queries. Business users underpowered and frustrated. And organizations left with two versions of the truth: one hidden in complex SQL scripts, the other cobbled together in spreadsheets.
Astrato bridges this gap. With click-driven Advanced Calculations built directly on top of the Semantic Layer, teams get the best of both worlds: the analytical power of SQL, with the accessibility and consistency of true self-service BI.
Astrato’s Approach: Simplify without Stupefying
Most BI platforms tackled self-service the same way: they stripped out complexity, leaving users with a thin layer of totals and averages. Easy to use? Yes. But shallow. Astrato took a different path.
We asked: what if business users could get the power of SQL window functions without ever touching SQL?
That’s how Advanced Calculations in Astrato were born – a way to simplify without dumbing it down.
- No-code interface: Instead of writing LAG() or PARTITION BY, you point and click. A sales manager can layer “previous quarter” onto a revenue chart in seconds.
- Dynamic charts: Calculations update instantly when you filter, slice, or drill down. No refresh lag, no waiting for an analyst to re-run a query.
- Semantic Layer consistency: Because every calculation is built on governed definitions, “Revenue” means the same thing in Sales as it does in Finance. Period-over-period comparisons are finally trustworthy.
- Cloud-native performance: Calculations run directly on your data warehouse, so even complex queries perform at the speed your business needs.
The result is a self-service experience that’s both powerful and approachable. Business users can perform the kind of analysis once reserved for SQL experts, while analysts are freed from endless ad-hoc requests.
This is what self-service BI was always meant to be: power without the pain.
The Five Key Types of Advanced Calculations in Astrato
So what does this look like in practice? Here are five of the most common calculations business teams use in Astrato – and the questions they help answer.
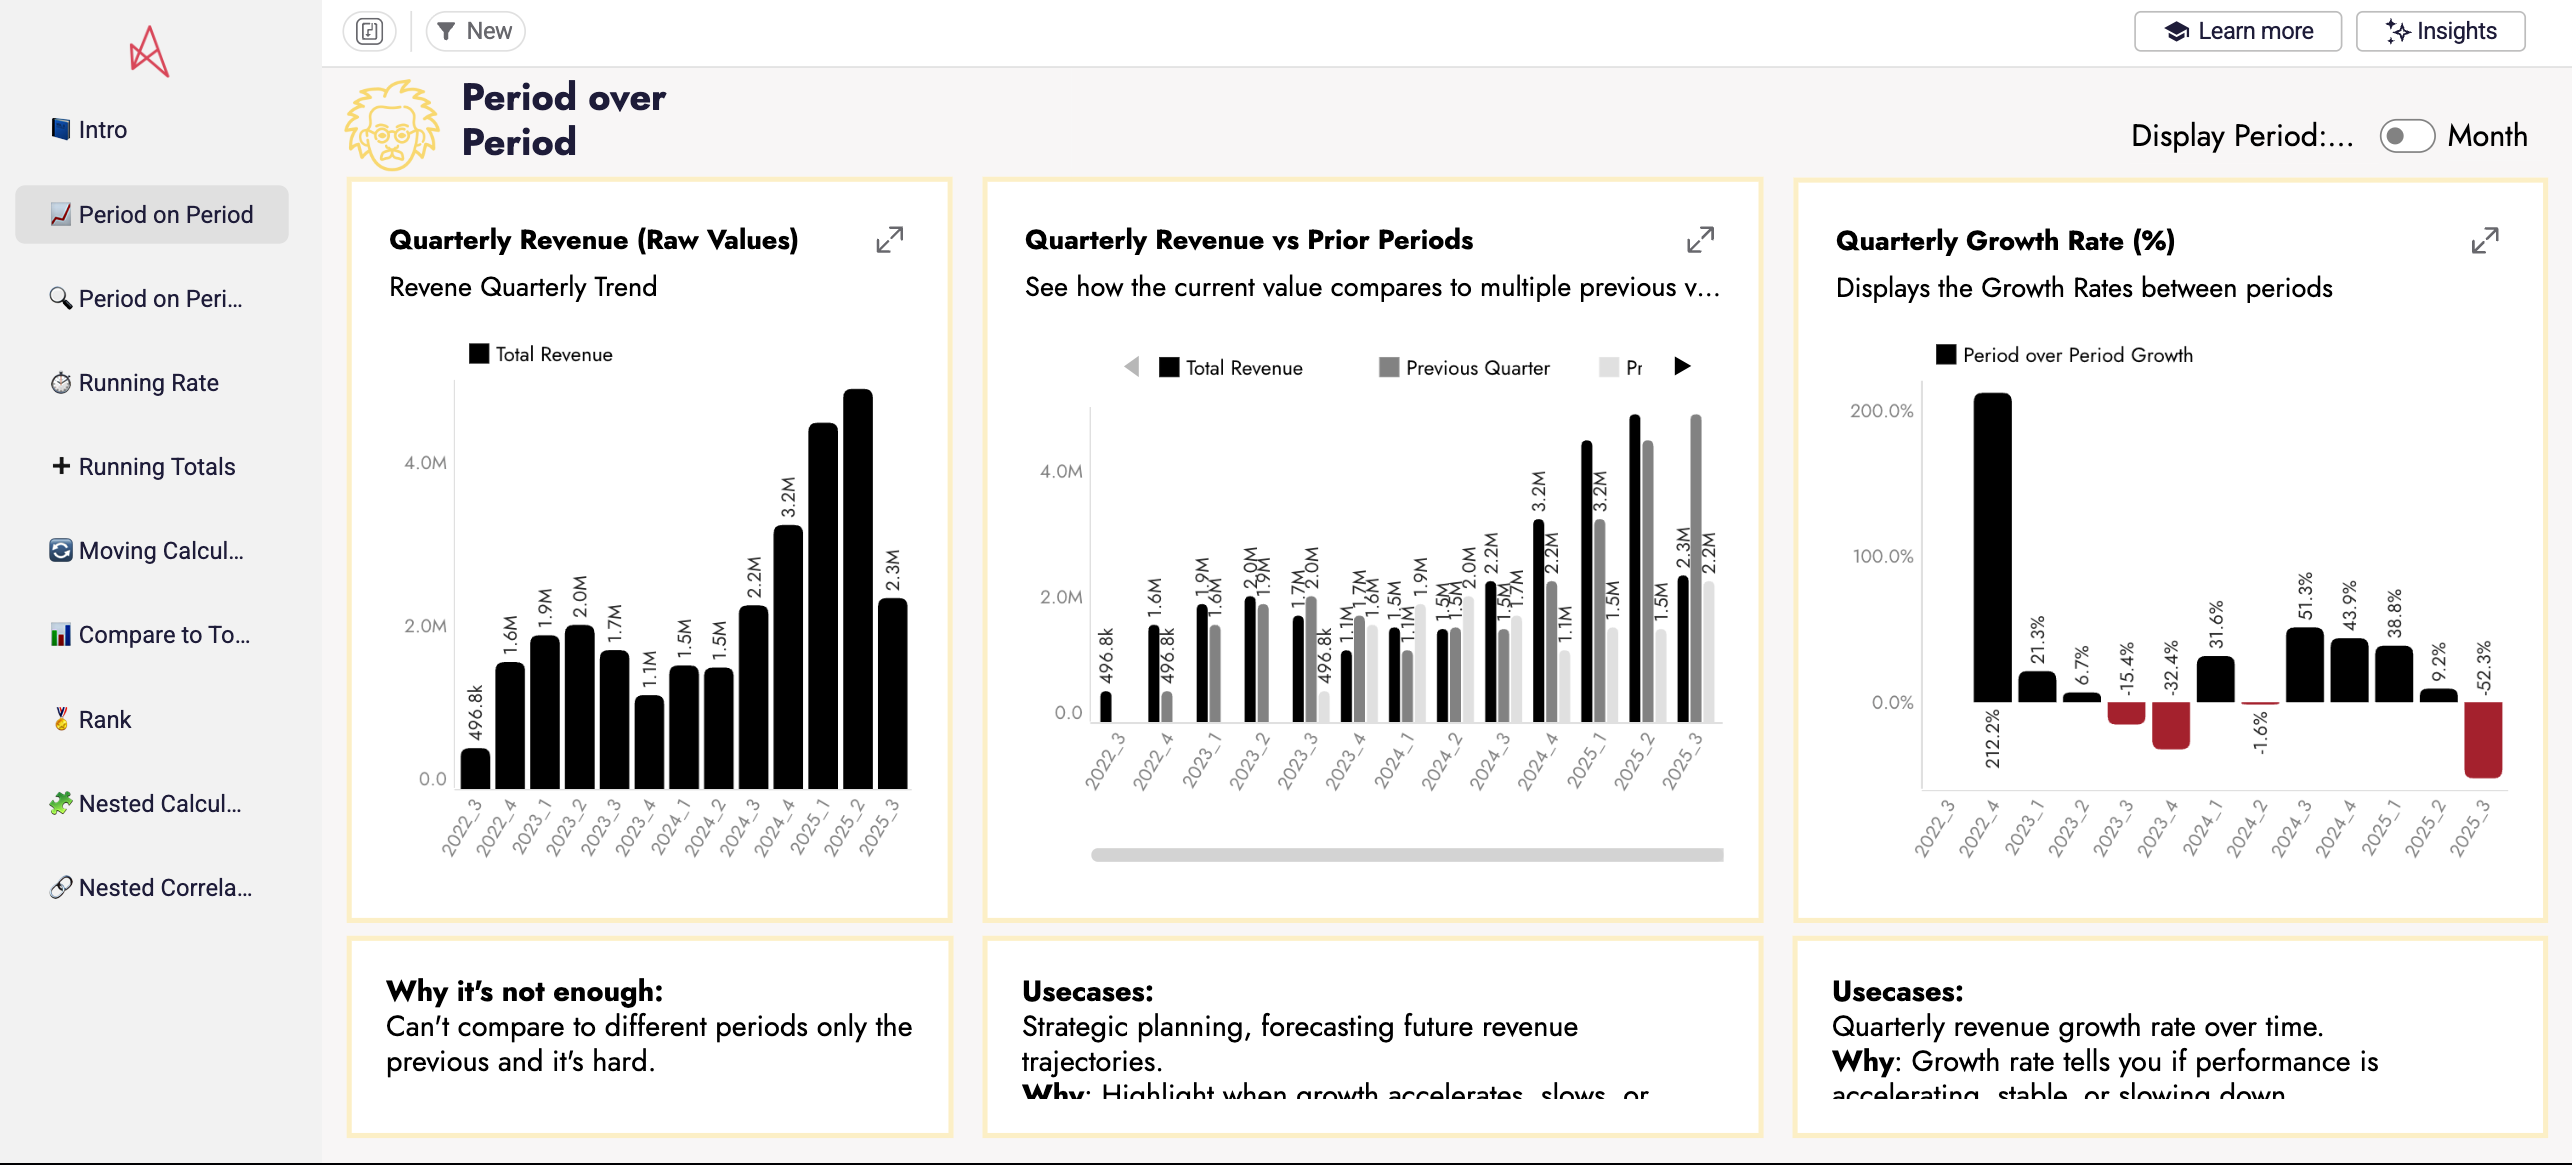
1. Period-over-period analysis
This calculation compares performance across time – quarter over quarter, year over year, or even month over month.
Instead of just seeing that revenue rose in Q2, you can immediately tell whether it’s an improvement over Q1 or last year’s Q2. That context turns a flat “we’re up 8%” into a story about momentum.
2. Running totals and running rates
Running totals accumulate values over time, making long-term contribution and growth pace easier to spot. Running rates take it further by normalizing different categories to show relative performance.
For instance, you might see that while bikes generate more revenue than accessories, both categories are actually increasing at the same pace – meaning your cross-sell strategy is working.
3. Moving averages
A moving average smooths out volatility so you can see the underlying trend.
Instead of being distracted by weekend dips or holiday spikes, you can understand whether customer engagement is consistently rising or falling. It’s like tuning out background static so the melody of the data comes through clearly.
4. Ranking and rank comparison
Ranking highlights leaders and laggards, while rank comparison shows how their positions shift over time.
You might discover that one region has quietly climbed into the top three for sales, while another has slipped down the chart. These shifts point you toward the markets that deserve more focus – and those that need intervention.
5. Segmentation with percentiles
Percentile-based calculations classify products, customers, or regions into performance tiers.
Instead of treating your entire portfolio the same, you can identify the top 25% of products that drive margin, the middle 50% that need nurturing, and the bottom tier that may not be worth further investment. This clarity helps teams prioritize where effort will pay off most.
3 Common Mistakes to Avoid
Mistake 1: Treating Advanced Calculations as “Extra”
One of the biggest traps with advanced calculations is thinking they’re optional – a nice-to-have rather than a core part of analysis.
Imagine a sales manager who only ever looks at quarterly totals. On paper, everything looks fine: revenue is up 5%. But without a quarter-over-quarter growth calculation, she misses the warning sign that the pace of growth has been slowing for three straight quarters. By the time the slowdown showed up in the totals, the business had already lost valuable ground.
Mistake 2: Skipping Context
Another common misstep is skipping context. It’s easy to drag a measure into a chart and compare values, but unless you’ve defined which period or which dimension you’re comparing against, the insight can be misleading.
Is that revenue increase truly an improvement, or is it just the result of a seasonal spike? This is where Astrato’s Semantic Layer becomes your safety net. It locks in business definitions and ensures that “quarter,” “revenue,” or “churn” mean the same thing every time you run a calculation. That way, your comparisons aren’t just quick – they’re trustworthy.
Mistake 3: Overcomplicating Too Soon
And then there’s the temptation to do too much, too soon. A dashboard loaded with five different advanced functions might look impressive, but it often overwhelms the very people it’s meant to help. The story gets lost in a sea of lines and bars.
The better approach is to build gradually. Start with a simple period-over-period comparison on your most important KPI. Once your stakeholders see the value – the “aha!” moment of spotting a trend they’d have missed otherwise – you can layer in running totals, rankings, or segmentations.
Takeaway: Advanced calculations are powerful, but only when they’re used with intention. Think of them as highlights in a book: you don’t highlight every line, you mark the ones that matter. With Astrato, it only takes a few clicks to apply these functions, but the real skill lies in knowing where to focus – and letting the Semantic Layer ensure the story holds together across your organization.
Real-World Use Cases Across the Business
Advanced calculations have often been locked away with analysts and SQL experts. In Astrato, they’re accessible to every team – from Marketing to Finance – helping each department uncover insights that were previously out of reach.
Here’s how different departments use advanced calculations to answer questions that once required an analyst.
Marketing: Measure campaign ROI with confidence
Marketing teams often need to prove impact by comparing this year’s campaign ROI to last year’s. Traditionally, that means exporting data into spreadsheets or waiting for an analyst to code a custom SQL query. With Astrato, a marketer can apply a period-over-period calculation directly on the dashboard, layering last year’s results over this year’s in seconds. The Semantic Layer ensures ROI is defined consistently, so the debate shifts from “Whose numbers are right?” to “Which campaign deserves more budget?”
Sales: Spot the fast risers in your portfolio
Sales leaders don’t just want totals – they want to know which products are gaining momentum. By applying running totals and ranking, they can quickly see which items are climbing fastest and which are losing ground. Instead of reacting months later, they can double down on emerging winners early.
Customer Success: Detect churn signals before they spike
Daily retention numbers swing wildly, making it hard to separate noise from signal. A moving average smooths the fluctuations and reveals the underlying trend. Customer success teams can see that churn among a specific segment is gradually rising and act before the issue becomes a headline problem.
Finance: Compare performance across regions
Finance teams often need to understand which regions are pulling ahead or falling behind. With rank comparisons, they can see not just who’s on top, but how standings have shifted year-over-year. That means faster, more confident decisions about where to invest or adjust resources.
By putting these advanced calculations directly in the hands of business users, Astrato helps every team move from reporting the past to shaping the future.
Conclusion: Key Takeaways
Advanced calculations give business users the context behind the numbers – whether that’s spotting trends earlier, comparing fairly, or ranking performance across markets.
In SQL they require complex window functions. In Astrato they’re just a few clicks, backed by the Semantic Layer for consistency.
The takeaway is simple: advanced analysis doesn’t have to be complicated, and it doesn’t have to be limited to specialists.
👉 Next step: Try applying your first advanced calculation in Astrato today – simply add this demo app to your Astrato workspace.
FAQs
Are advanced calculations the same as calculated measures?
No – calculated measures are new metrics you define (e.g., Gross Margin). Advanced calculations apply analytical functions (e.g., rolling average, YoY growth) on top of those measures.
What’s the industry term for advanced calculations?
They’re widely known as analytical functions or window functions in SQL. Astrato makes them no-code.
How does the Semantic Layer fit in?
It provides the business-ready definitions (Revenue, Active Users, Churn) that advanced calculations build on. That way, all teams calculate on the same foundation.


.avif)


